Copyright
©The Author(s) 2015.
World J Gastroenterol. Jan 7, 2015; 21(1): 221-228
Published online Jan 7, 2015. doi: 10.3748/wjg.v21.i1.221
Published online Jan 7, 2015. doi: 10.3748/wjg.v21.i1.221
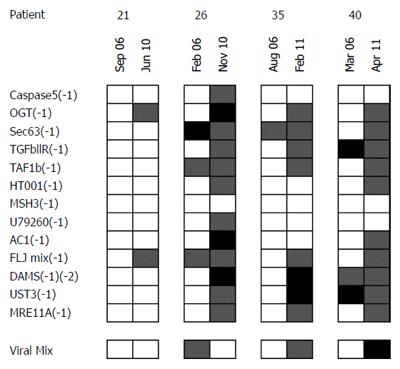
Figure 3 Repeated measurements of immune responses of 4 patients.
Patient samples are arranged along the X-axis, FSP antigens along the Y-axis. Squares represent normalized mean counts of interferon-γ-secreting T cells after subtraction of background and standard errors of peptide-specific counts and no peptide control counts. Open boxes: Adjusted T-cell count 0; Shaded boxes: Adjusted T-cell count 0 to 2.5; Solid boxes: Adjusted T-cell count > 2.5.
- Citation: Kuehn F, Klar E, Bliemeister A, Linnebacher M. Reactivity against microsatellite instability-induced frameshift mutations in patients with inflammatory bowel disease. World J Gastroenterol 2015; 21(1): 221-228
- URL: https://www.wjgnet.com/1007-9327/full/v21/i1/221.htm
- DOI: https://dx.doi.org/10.3748/wjg.v21.i1.221


