Copyright
©2014 Baishideng Publishing Group Co.
World J Gastroenterol. Feb 28, 2014; 20(8): 2107-2112
Published online Feb 28, 2014. doi: 10.3748/wjg.v20.i8.2107
Published online Feb 28, 2014. doi: 10.3748/wjg.v20.i8.2107
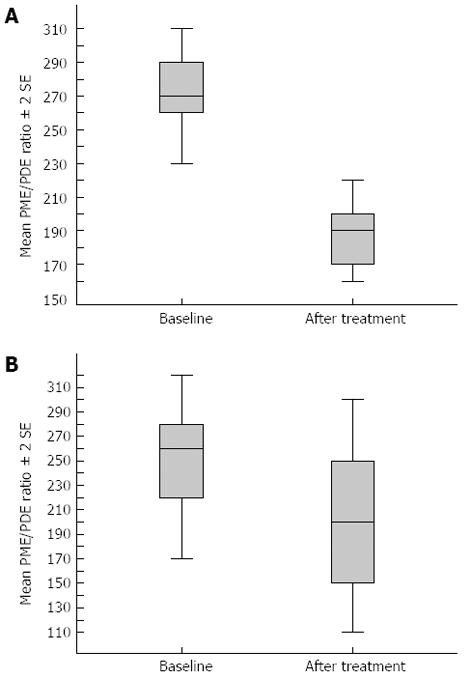
Figure 1 Change in phosphomonoester to phosphodiester ratio between baseline and after treatment in the responder group (A), and the nonresponder group (B).
PME/PDE: Phosphomonoester/phosphodiester.
- Citation: Zhang CY, Zhang Q, Zhang HM, Yang HS. 3.0T 31P MR spectroscopy in assessment of response to antiviral therapy for chronic hepatitis C. World J Gastroenterol 2014; 20(8): 2107-2112
- URL: https://www.wjgnet.com/1007-9327/full/v20/i8/2107.htm
- DOI: https://dx.doi.org/10.3748/wjg.v20.i8.2107


