Copyright
©2014 Baishideng Publishing Group Co.
World J Gastroenterol. Feb 21, 2014; 20(7): 1807-1821
Published online Feb 21, 2014. doi: 10.3748/wjg.v20.i7.1807
Published online Feb 21, 2014. doi: 10.3748/wjg.v20.i7.1807
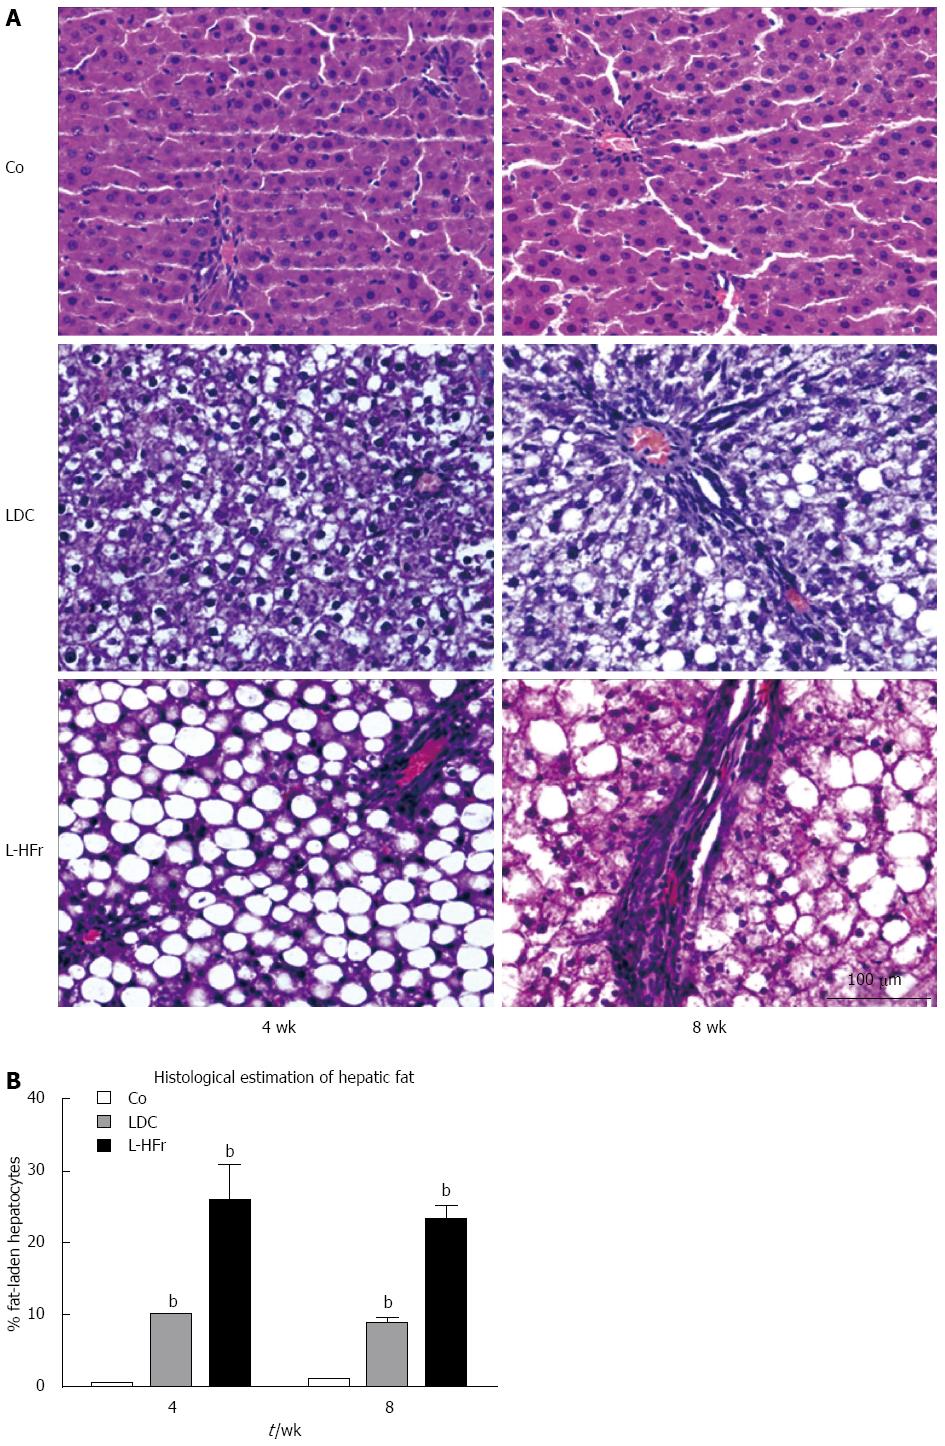
Figure 6 Microphotograph of representative livers of rats on different dietary regimens for 4 or 8 wk.
A: The left panel (4-wk) and right panel (8-wk) of HE stained livers show: Co: control group exhibiting normal arrangement of hepatocytes around the sinusoids; LDC: Lieber-DeCarli nourished group represented principally micro- and randomly macro-steatosis at 4 and 8 wk respectively; L-HFr: 70% cal fructose supplemented LDC group showing almost hepatocytes around the portal triads with macrovesicular steatosis shows clear, rounded, and well-defined fat droplets (often single) within the cytoplasm and the nuclei are peripherally displaced by the fat droplets clearly at 4 wk more than 8 wk of experiment time, accompanied with loss of structural integrity and vessel architecture. Scale bar = 100 μm; B: Percentage of hepatocytes with macro fat vesicles was microscopically evaluated by a pathologist in HE stained liver slices. bP < 0.01 vs Co.
- Citation: Alwahsh SM, Xu M, Seyhan HA, Ahmad S, Mihm S, Ramadori G, Schultze FC. Diet high in fructose leads to an overexpression of lipocalin-2 in rat fatty liver. World J Gastroenterol 2014; 20(7): 1807-1821
- URL: https://www.wjgnet.com/1007-9327/full/v20/i7/1807.htm
- DOI: https://dx.doi.org/10.3748/wjg.v20.i7.1807


