Copyright
©2014 Baishideng Publishing Group Co.
World J Gastroenterol. Feb 21, 2014; 20(7): 1807-1821
Published online Feb 21, 2014. doi: 10.3748/wjg.v20.i7.1807
Published online Feb 21, 2014. doi: 10.3748/wjg.v20.i7.1807
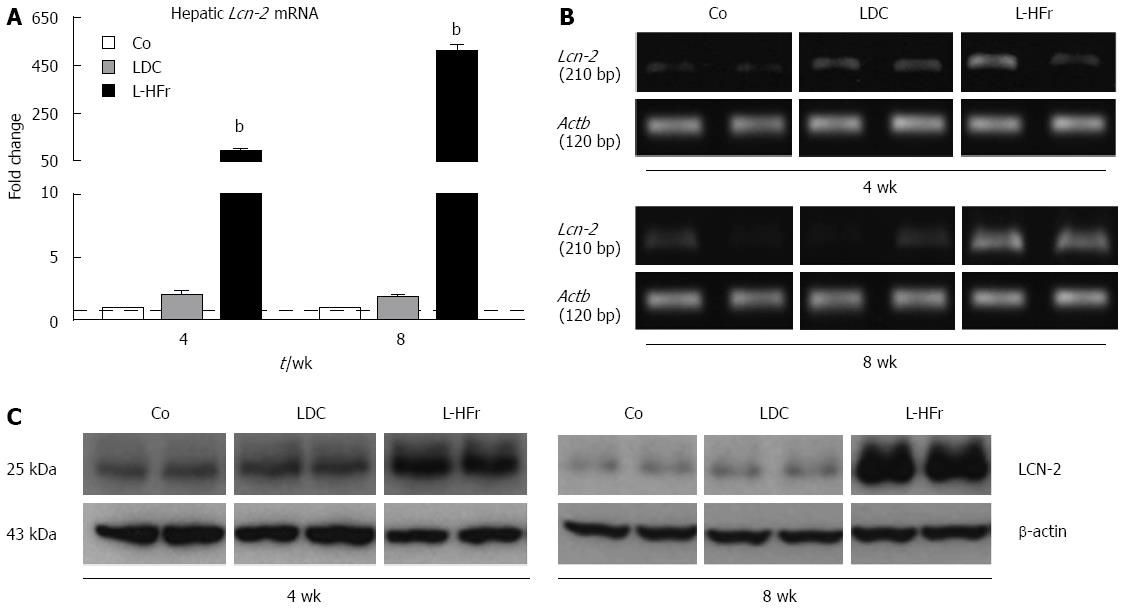
Figure 2 Changes in lipocalin-2 mRNA and protein expression in rats livers.
A: Bar plots show relative specific mRNA levels in hepatic samples. Each bar represents as mean ± SEM of 4 rats/group at weeks 4 and 8. Data were normalized by ubiquitin C. β-actin (Actb) was used as an additional reference housekeeping gene, yielding comparable results; B: Photographs of end-point polymerase chain reaction products run on 1.1% agarose gel electrophoresis for hepatic Lcn-2 and Actb; C: Immunoblots of hepatic LCN-2 (two representative animals per group). bP < 0.01. Co: Chow pellets; LDC: Lieber-DeCarli liquid diet; L-HFr: LDC combined with 70% fructose.
- Citation: Alwahsh SM, Xu M, Seyhan HA, Ahmad S, Mihm S, Ramadori G, Schultze FC. Diet high in fructose leads to an overexpression of lipocalin-2 in rat fatty liver. World J Gastroenterol 2014; 20(7): 1807-1821
- URL: https://www.wjgnet.com/1007-9327/full/v20/i7/1807.htm
- DOI: https://dx.doi.org/10.3748/wjg.v20.i7.1807


