Copyright
©2014 Baishideng Publishing Group Co.
World J Gastroenterol. Feb 21, 2014; 20(7): 1807-1821
Published online Feb 21, 2014. doi: 10.3748/wjg.v20.i7.1807
Published online Feb 21, 2014. doi: 10.3748/wjg.v20.i7.1807
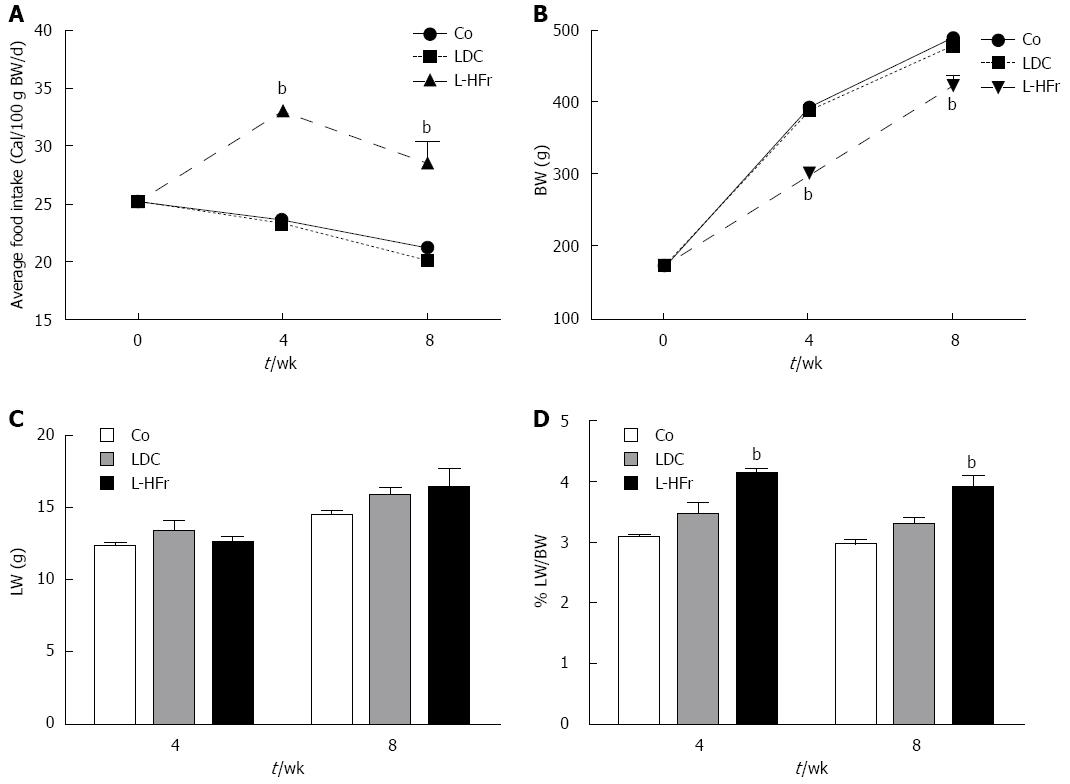
Figure 1 Phenotypes of the animals and daily food intake.
Linear graph shows the average of animals’ caloric intake (A) at weeks 0, 4 and 8 of the treatment (food intake was expressed as cal/100 g BW/d) and animals’ body weight (BW; B). Bar blots show liver weight (LW; C) and relative liver weight (RLW; D). Data are presented as mean ± SEM of 4 rats per group in correspondence to time points. Indicates statistically significant difference bP < 0.01 via one-way ANOVA. Standard chow pellets (Co), a fresh-prepared Lieber-DeCarli (LDC) liquid diet, and LDC combined with 70% cal fructose (L-HFr).
- Citation: Alwahsh SM, Xu M, Seyhan HA, Ahmad S, Mihm S, Ramadori G, Schultze FC. Diet high in fructose leads to an overexpression of lipocalin-2 in rat fatty liver. World J Gastroenterol 2014; 20(7): 1807-1821
- URL: https://www.wjgnet.com/1007-9327/full/v20/i7/1807.htm
- DOI: https://dx.doi.org/10.3748/wjg.v20.i7.1807


