Copyright
©2014 Baishideng Publishing Group Co.
World J Gastroenterol. Feb 7, 2014; 20(5): 1348-1356
Published online Feb 7, 2014. doi: 10.3748/wjg.v20.i5.1348
Published online Feb 7, 2014. doi: 10.3748/wjg.v20.i5.1348
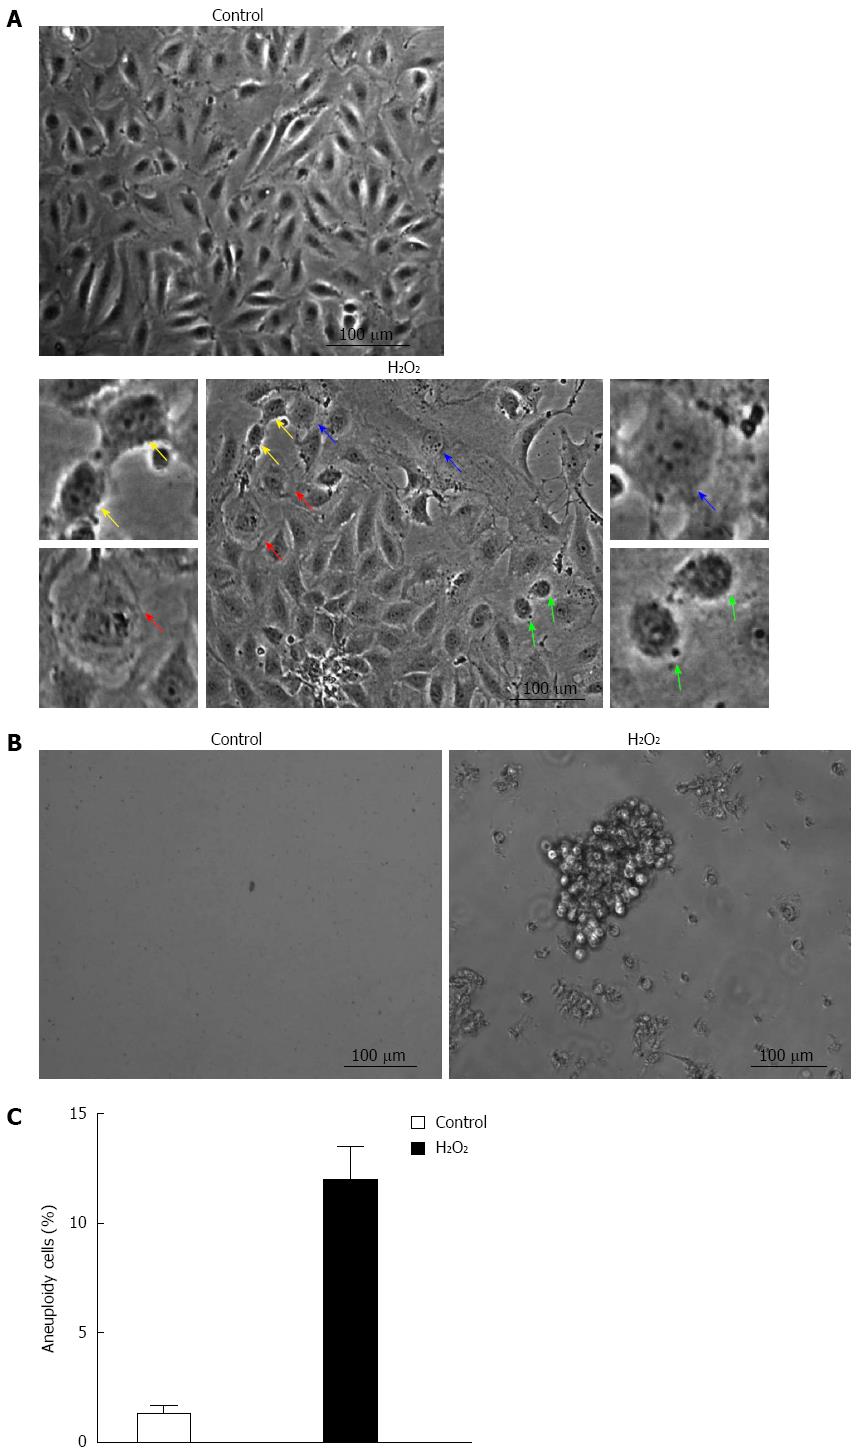
Figure 2 H2O2 induced WB-F344 malignant transformation.
A: The morphology of H2O2-treated WB-F344 cells. The cells were cultured in complete medium (control) or treated with 7 × 10⁻⁷ mol/L H2O2 12 h per day for 21 d. Cell morphology was observed under microscope (× 400). An increasing nucleus to cytoplasm ratio was observed (green arrow), as were many mitotic cells (yellow arrow), prokaryotes (blue arrow) and even tumor giant cells (red arrow); B: The tumorigenicity of transformed WB-F344 cells as determined using the methylcellulose culture assay. Cell colony formation was observed under microscope (× 400); C: H2O2 increased WB-F344 cell aneuploidy. The cells were cultured in complete medium (control) or treated with 7 × 10⁻⁷ mol/L H2O2 12 h per day for 21 d and harvested for flow cytometry. DNA was stained with propidium iodide (10 μg/mL), and a BD FACS Calibur was used to analyze cellular DNA content. The population of > 4N cells represent aneuploidy cells. Histograms indicating the aneuploidy cells among the control cells and the H2O2-treated cells. The data represent the mean ± SD derived from three independent experiments.
- Citation: Han YY, Xue XW, Shi ZM, Wang PY, Wu XR, Wang XJ. Oleanolic acid and ursolic acid inhibit proliferation in transformed rat hepatic oval cells. World J Gastroenterol 2014; 20(5): 1348-1356
- URL: https://www.wjgnet.com/1007-9327/full/v20/i5/1348.htm
- DOI: https://dx.doi.org/10.3748/wjg.v20.i5.1348


