Copyright
©2014 Baishideng Publishing Group Inc.
World J Gastroenterol. Dec 28, 2014; 20(48): 18249-18259
Published online Dec 28, 2014. doi: 10.3748/wjg.v20.i48.18249
Published online Dec 28, 2014. doi: 10.3748/wjg.v20.i48.18249
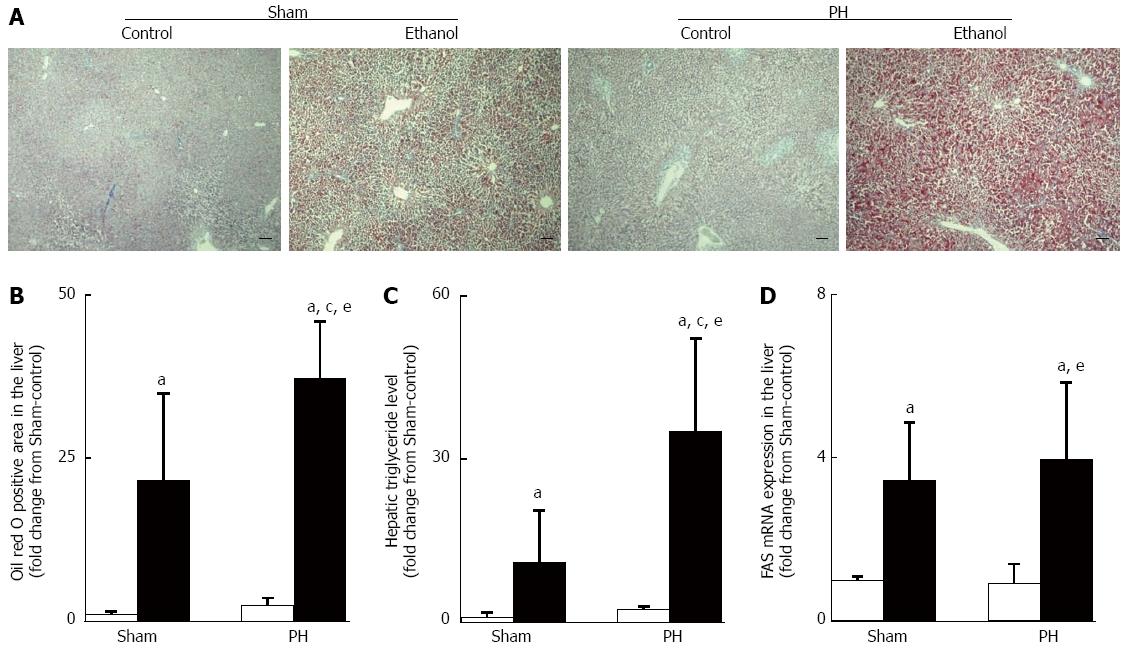
Figure 3 Ethanol-induced hepatic steatosis.
A: Representative examples of Oil red O stains of liver sections, scale bars = 100 μm; B: Oil red O positively stained area; C: Hepatic triglyceride levels; D: Fas mRNA expression. The open bar corresponds to the rats fed the control liquid diet, and the closed bar corresponds to the rats fed the ethanol liquid diet. All of the values shown are the mean ± SD, with 5 rats in each group, except for the hepatic triglyceride level values, which represent the mean ± SD of 4 rats per group. aP < 0.05 vs the Sham-control group, cP < 0.05 vs the Sham-ethanol group, eP < 0.05 vs the PH-control group using ANOVA. PH: Partial hepatectomy.
- Citation: Liu X, Hakucho A, Liu J, Fujimiya T. Delayed ethanol elimination and enhanced susceptibility to ethanol-induced hepatosteatosis after liver resection. World J Gastroenterol 2014; 20(48): 18249-18259
- URL: https://www.wjgnet.com/1007-9327/full/v20/i48/18249.htm
- DOI: https://dx.doi.org/10.3748/wjg.v20.i48.18249


