Copyright
©2014 Baishideng Publishing Group Inc.
World J Gastroenterol. Dec 28, 2014; 20(48): 18189-18198
Published online Dec 28, 2014. doi: 10.3748/wjg.v20.i48.18189
Published online Dec 28, 2014. doi: 10.3748/wjg.v20.i48.18189
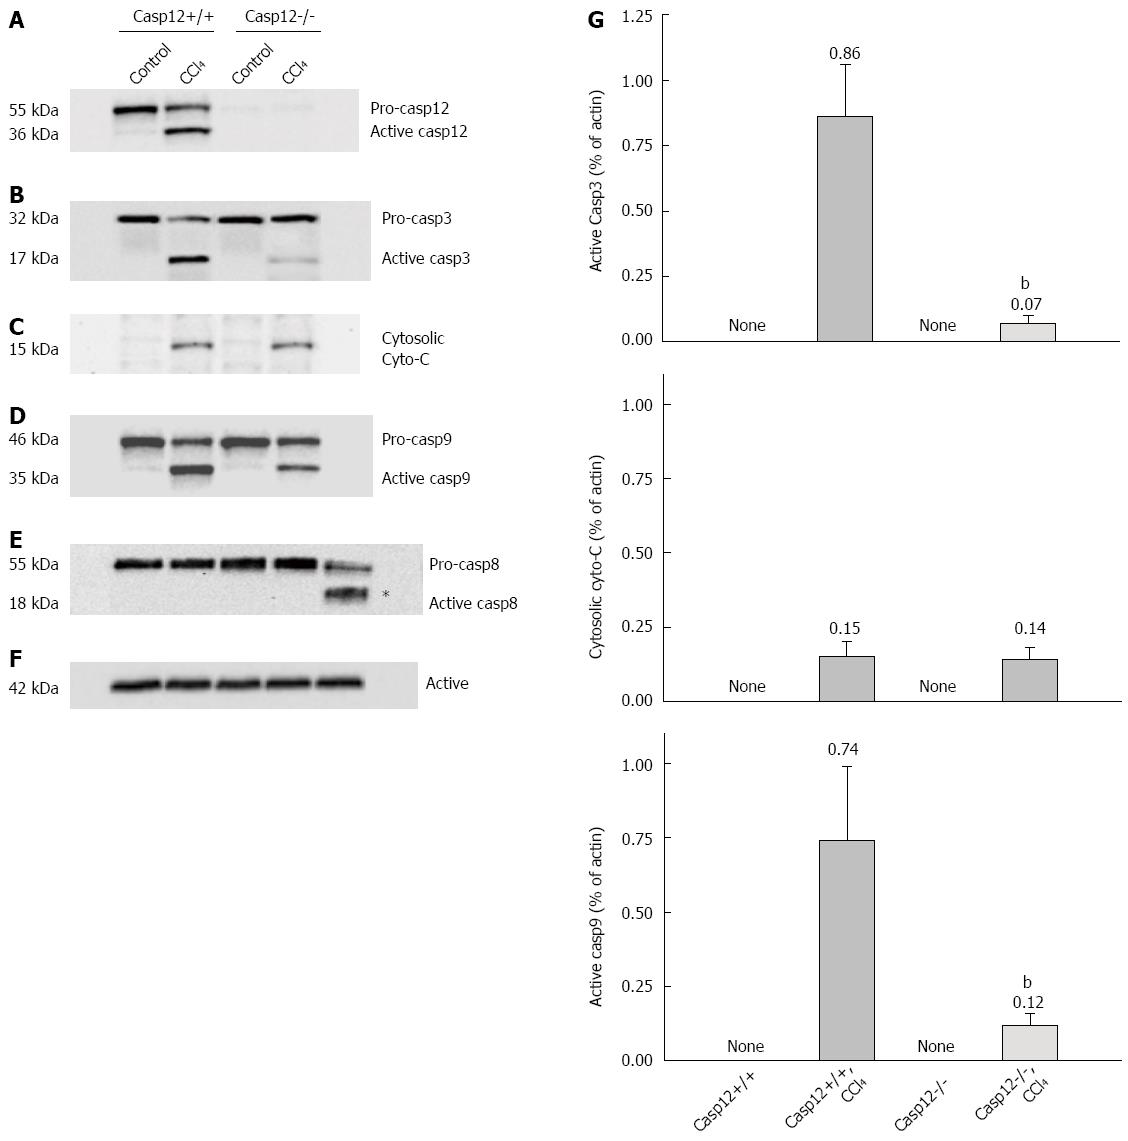
Figure 6 Activation of caspases and cytochrome C release in mice treated with carbon tetrachloride.
Western blot analysis of A: Caspase-12; B: Caspase-3; C: Cytochrome C release from mitochondria; D: Casapse-9; E: Caspase-8; F: Actin as control in CCl4-treated and control caspase-12+/+ and caspase-12-/- mice; G: Densitometric analyses of cytosolic cytochrome C and cleaved caspase-3 and -9 were performed from four independent Western blot experiments. The values were normalized to actin for each individual sample. Values are mean ± SE; aP < 0.05 vs CCl4-treated caspase-12+/+.
- Citation: Liu H, Wang Z, Nowicki MJ. Caspase-12 mediates carbon tetrachloride-induced hepatocyte apoptosis in mice. World J Gastroenterol 2014; 20(48): 18189-18198
- URL: https://www.wjgnet.com/1007-9327/full/v20/i48/18189.htm
- DOI: https://dx.doi.org/10.3748/wjg.v20.i48.18189


