Copyright
©2014 Baishideng Publishing Group Inc.
World J Gastroenterol. Dec 21, 2014; 20(47): 17985-17992
Published online Dec 21, 2014. doi: 10.3748/wjg.v20.i47.17985
Published online Dec 21, 2014. doi: 10.3748/wjg.v20.i47.17985
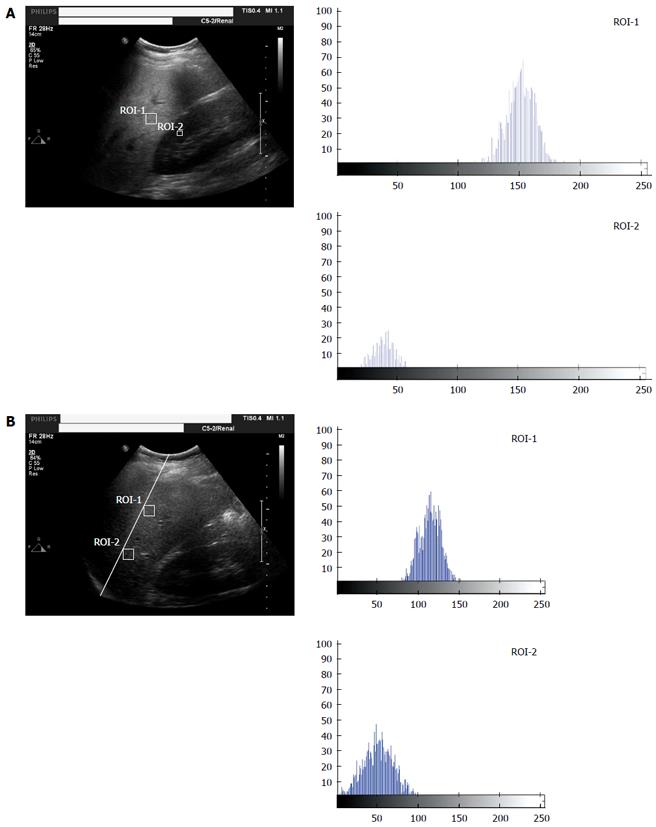
Figure 1 Ultrasonic liver image with hepatic/renal ratio and hepatic echo-intensity attenuation rate.
A: Ultrasonic liver image with hepatic/renal ratio. ROI-1 and ROI-2 stands for the echo gray histograms of the liver and kidney cortex ROIs; B: Ultrasonic liver image with hepatic echo-intensity attenuation rate. ROI-1 and ROI-2 stands for the near-field and far-field echo gray histograms of the liver. ROI: Region of interest.
- Citation: Zhang B, Ding F, Chen T, Xia LH, Qian J, Lv GY. Ultrasound hepatic/renal ratio and hepatic attenuation rate for quantifying liver fat content. World J Gastroenterol 2014; 20(47): 17985-17992
- URL: https://www.wjgnet.com/1007-9327/full/v20/i47/17985.htm
- DOI: https://dx.doi.org/10.3748/wjg.v20.i47.17985


