Copyright
©2014 Baishideng Publishing Group Inc.
World J Gastroenterol. Dec 21, 2014; 20(47): 17883-17893
Published online Dec 21, 2014. doi: 10.3748/wjg.v20.i47.17883
Published online Dec 21, 2014. doi: 10.3748/wjg.v20.i47.17883
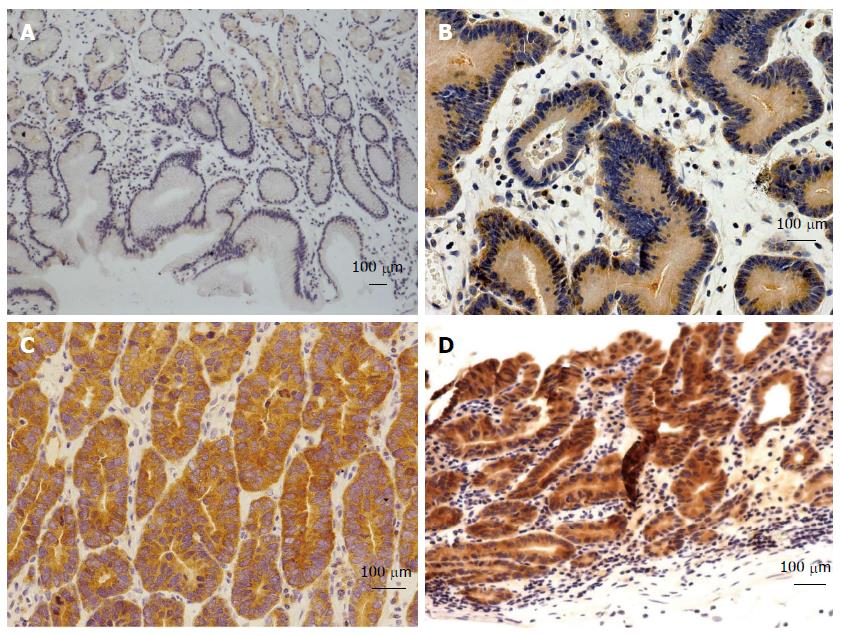
Figure 5 Representative immunohistochemistry for G0S2 in gastric samples.
Representative samples are shown from G0S2 (A) chronic gastritis tissues with negative expression, and G0S2 (B) low-grade intraepithelial neoplasia tissues with low expression, G0S2 (C) high-grade intraepithelial neoplasia tissues with medium expression, and G0S2 (D) early-stage adenocarcinoma tissues with high expression (bar represents 100 μm).
- Citation: Xu X, Feng L, Liu Y, Zhou WX, Ma YC, Fei GJ, An N, Li Y, Wu X, Yao F, Cheng SJ, Lu XH. Differential gene expression profiling of gastric intraepithelial neoplasia and early-stage adenocarcinoma. World J Gastroenterol 2014; 20(47): 17883-17893
- URL: https://www.wjgnet.com/1007-9327/full/v20/i47/17883.htm
- DOI: https://dx.doi.org/10.3748/wjg.v20.i47.17883


