Copyright
©2014 Baishideng Publishing Group Inc.
World J Gastroenterol. Dec 21, 2014; 20(47): 17883-17893
Published online Dec 21, 2014. doi: 10.3748/wjg.v20.i47.17883
Published online Dec 21, 2014. doi: 10.3748/wjg.v20.i47.17883
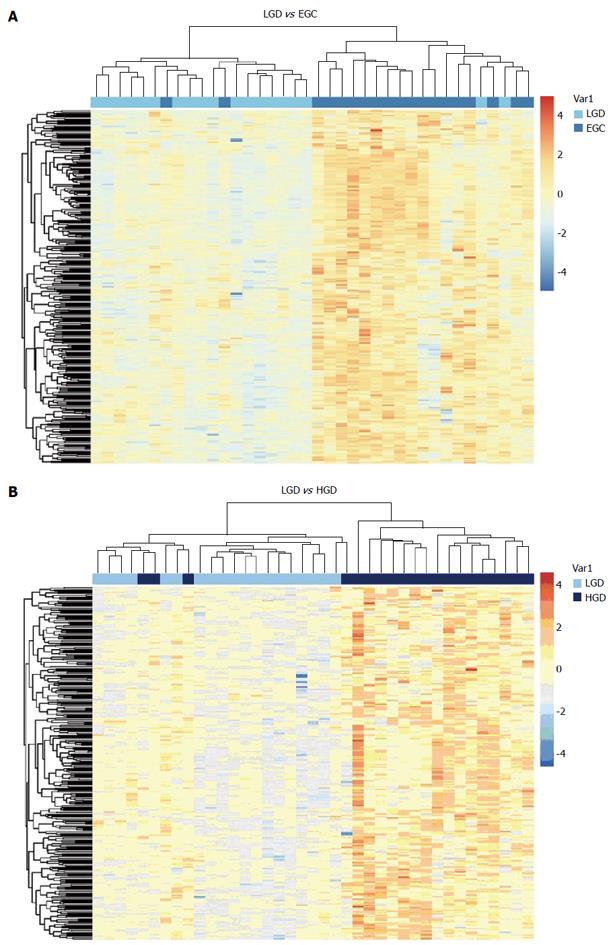
Figure 2 Unsupervised cluster analysis of gastric low-grade intraepithelial neoplasia and early-stage adenocarcinoma (A), low-grade intraepithelial neoplasia and high-grade intraepithelial neoplasia (B) tissue samples with the 289 differentially expressed transcripts.
The transverse blue bar indicates the histopathological type of the tissue samples: A: Light blue, low-grade intraepithelial neoplasia (LGIN); Dark blue, early-stage adenocarcinoma (EGC); B: Light blue, LGIN; Dark blue, high-grade intraepithelial neoplasia (HGIN). Each column represents a sample, and each row represents a transcript. The expression abundance from low levels to high levels is shown in colors from blue to red.
- Citation: Xu X, Feng L, Liu Y, Zhou WX, Ma YC, Fei GJ, An N, Li Y, Wu X, Yao F, Cheng SJ, Lu XH. Differential gene expression profiling of gastric intraepithelial neoplasia and early-stage adenocarcinoma. World J Gastroenterol 2014; 20(47): 17883-17893
- URL: https://www.wjgnet.com/1007-9327/full/v20/i47/17883.htm
- DOI: https://dx.doi.org/10.3748/wjg.v20.i47.17883


