Copyright
©2014 Baishideng Publishing Group Inc.
World J Gastroenterol. Dec 21, 2014; 20(47): 17863-17876
Published online Dec 21, 2014. doi: 10.3748/wjg.v20.i47.17863
Published online Dec 21, 2014. doi: 10.3748/wjg.v20.i47.17863
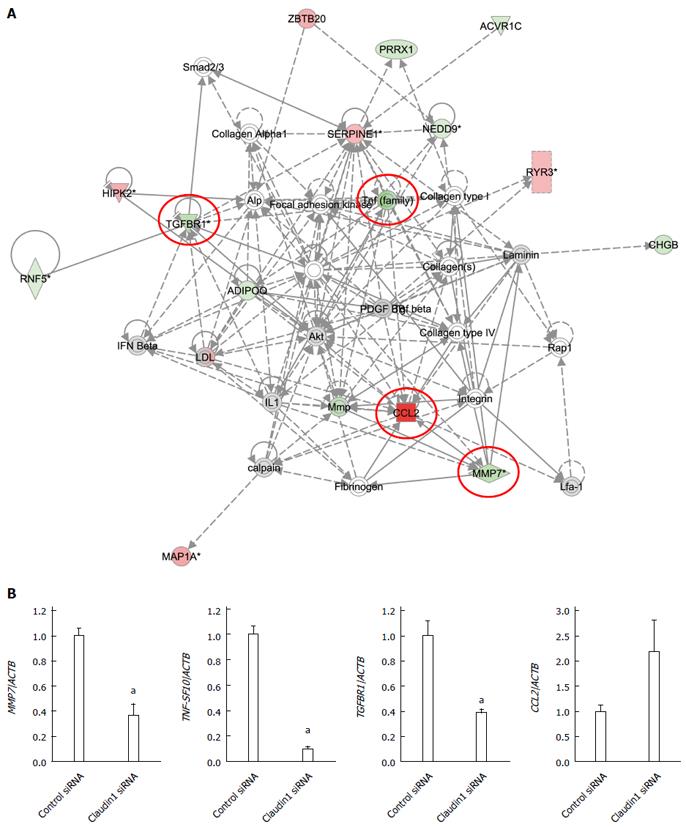
Figure 4 Analysis of gene expression change in claudin 1 siRNA transfected MKN28 cells.
A: One of the top-ranked signaling networks related to claudin 1 down-regulation according to ingenuity pathway analysis. Red and green indicate genes whose expression levels were higher or lower, respectively, than reference RNA levels. Genes analyzed for verification were highlighted by red circles; B: Verification of gene expression by real-time quantitative RT-PCR. The expression levels of for selected genes MMP7, TNF-SF10, TGFBR1, and CCL2 in claudin 1 siRNA transfected MKN28 cells were compared with those in control siRNA transfected cells. Gene expression levels were normalized to the level of ACTB. Mean ± SE. n = 3. aP < 0.05 vs control siRNA.
- Citation: Shiozaki A, Shimizu H, Ichikawa D, Konishi H, Komatsu S, Kubota T, Fujiwara H, Okamoto K, Iitaka D, Nakashima S, Nako Y, Liu M, Otsuji E. Claudin 1 mediates tumor necrosis factor alpha-induced cell migration in human gastric cancer cells. World J Gastroenterol 2014; 20(47): 17863-17876
- URL: https://www.wjgnet.com/1007-9327/full/v20/i47/17863.htm
- DOI: https://dx.doi.org/10.3748/wjg.v20.i47.17863


