Copyright
©2014 Baishideng Publishing Group Inc.
World J Gastroenterol. Dec 14, 2014; 20(46): 17558-17567
Published online Dec 14, 2014. doi: 10.3748/wjg.v20.i46.17558
Published online Dec 14, 2014. doi: 10.3748/wjg.v20.i46.17558
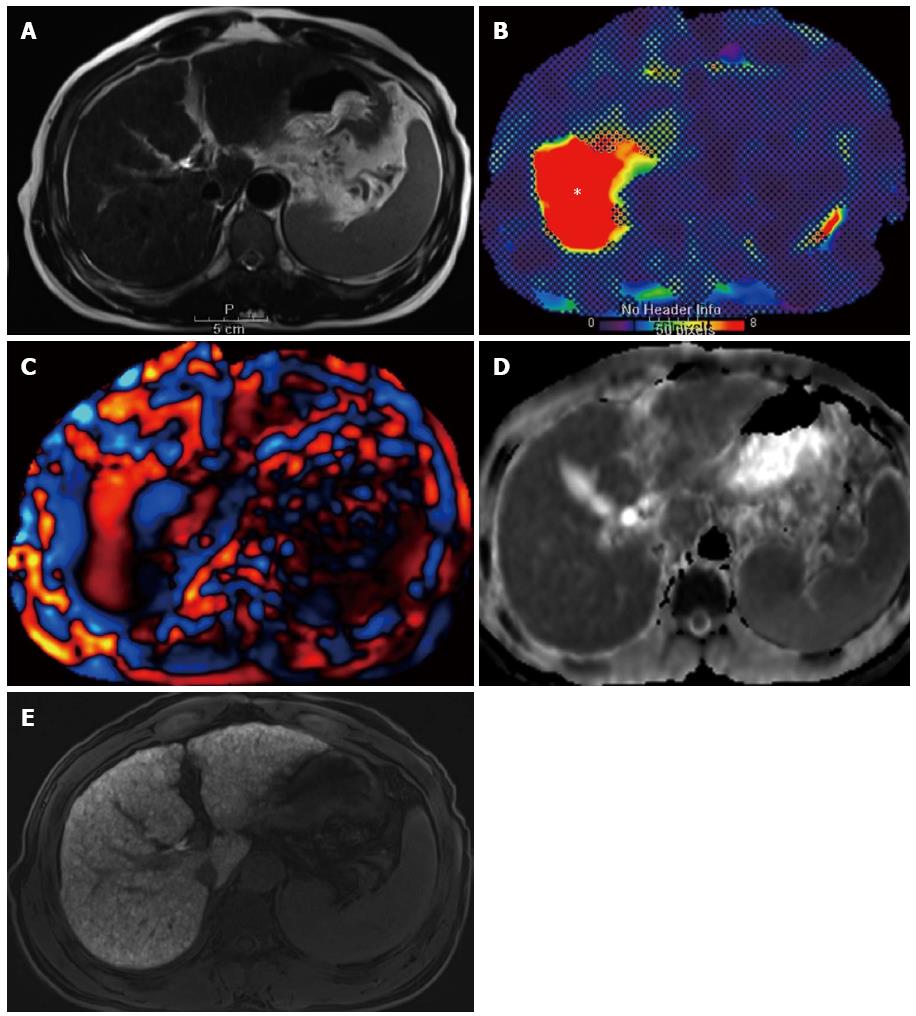
Figure 3 A 58-year-old man in the hepatic fibrosis group, who had hepatitis B virus-associated liver cirrhosis.
A: T2-weighted reference image on which the measurement of three MR parameters were performed; B: MRE (95% confidence map) shows increased stiffness value of 11.64 kPa (asterisk) in the right lobe of the liver; C: Wave image shows elongated wavelength of the corresponding liver parenchyma; D: ADC map of the DWI image with b = 400 at the same level as A. Measured ADC value was 1.011 × 10⁻³ mm2/s; E: Hepatobiliary phase image of gadoxetic acid-enhanced MR at the same level as A. Measured CEI was 1.701. MR: Magnetic resonance; MRE: Magnetic resonance elastography; DWI: Diffusion weighted image; ADC: Apparent diffusion coefficient; CEI: Contrast enhancement ratio.
- Citation: Park HS, Kim YJ, Yu MH, Choe WH, Jung SI, Jeon HJ. Three-Tesla magnetic resonance elastography for hepatic fibrosis: Comparison with diffusion-weighted imaging and gadoxetic acid-enhanced magnetic resonance imaging. World J Gastroenterol 2014; 20(46): 17558-17567
- URL: https://www.wjgnet.com/1007-9327/full/v20/i46/17558.htm
- DOI: https://dx.doi.org/10.3748/wjg.v20.i46.17558


