Copyright
©2014 Baishideng Publishing Group Inc.
World J Gastroenterol. Dec 14, 2014; 20(46): 17439-17447
Published online Dec 14, 2014. doi: 10.3748/wjg.v20.i46.17439
Published online Dec 14, 2014. doi: 10.3748/wjg.v20.i46.17439
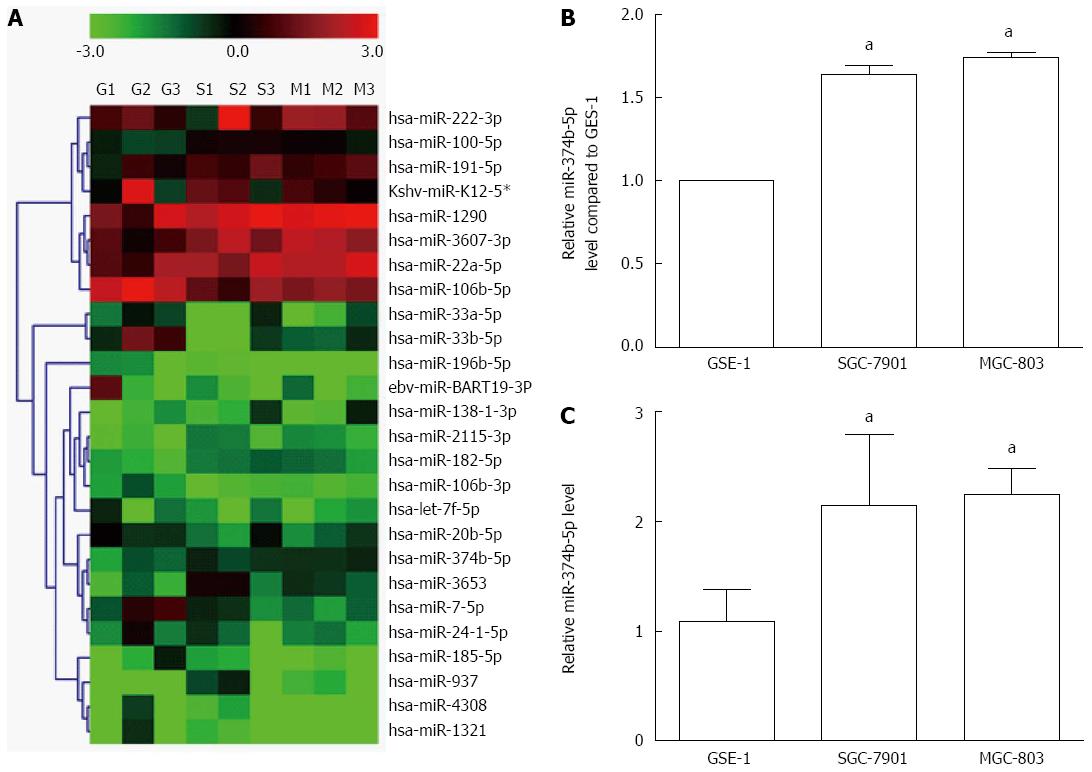
Figure 1 Differential expression of microRNAs in gastric cancer cells.
A: microRNA (miRNA) expression in gastric cancer cell lines SGC-7901 and MGC-803 was compared with the normal GES-1 cell line using cluster analysis. All cell samples were detected in triplicate, such that the nine lanes include GES-1 (G1-G3), SGC-7901 (S1-S3) and MGC-803 (M1-M3). The color scale denotes the extent of relative upregulation (red) and downregulation (green); B: Histogram of miR-374b-5p expression detected by cluster analysis; C: Confirmation of miR-374b-5p expression via quantitative real-time reverse transcription-polymerase chain reaction (n = 3); aP < 0.05 vs GSE-1.
- Citation: Xie J, Tan ZH, Tang X, Mo MS, Liu YP, Gan RL, Li Y, Zhang L, Li GQ. miR-374b-5p suppresses RECK expression and promotes gastric cancer cell invasion and metastasis. World J Gastroenterol 2014; 20(46): 17439-17447
- URL: https://www.wjgnet.com/1007-9327/full/v20/i46/17439.htm
- DOI: https://dx.doi.org/10.3748/wjg.v20.i46.17439


