Copyright
©2014 Baishideng Publishing Group Inc.
World J Gastroenterol. Dec 14, 2014; 20(46): 17416-17425
Published online Dec 14, 2014. doi: 10.3748/wjg.v20.i46.17416
Published online Dec 14, 2014. doi: 10.3748/wjg.v20.i46.17416
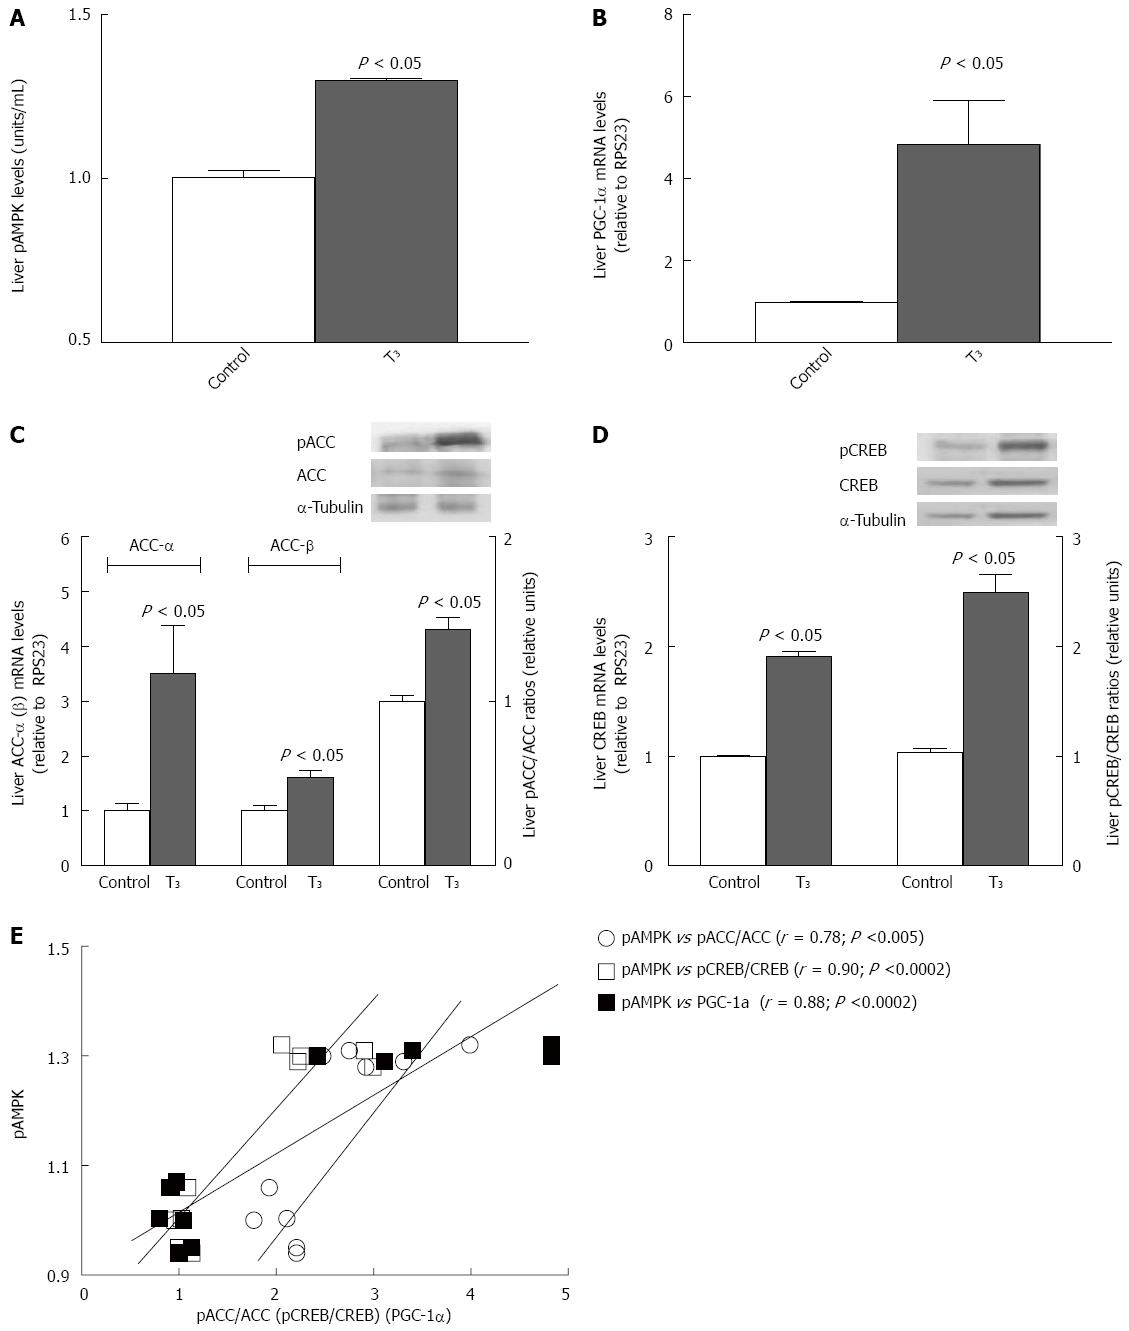
Figure 2 T3-induced changes in liver direct AMP-activated protein kinase targets.
A: pAMPK levels; B: PGC-1α mRNA content; C: Contents of ACC-α mRNA and pACC-α; D: Levels of CREB mRNA and pCREB/CREB ratios; E: Correlations between pAMPK and pACC-α, pCREB/CREB ratios, and PGC-1α. Values shown are means ± SEM (n = 3-6). Statistical significance was performed by one-way ANOVA and the Newman-Keuls, test (C, D) or Student,s t-test for unpaired data (A, B) (P < 0.05). Associations between variables were analyzed by the Pearson correlation coefficient. pAMPK: Phosphorylated AMP-activated protein kinase; (p) ACC-α: (Phosphorylated) acetyl-CoA carboxylase-α; (p)CREB: (phosphorylated) cAMP-response element-binding protein; PGC-1α: Peroxisome proliferator-activated receptor-γ coactivator-1α.
- Citation: Videla LA, Fernández V, Cornejo P, Vargas R, Morales P, Ceballo J, Fischer A, Escudero N, Escobar O. T3-induced liver AMP-activated protein kinase signaling: Redox dependency and upregulation of downstream targets. World J Gastroenterol 2014; 20(46): 17416-17425
- URL: https://www.wjgnet.com/1007-9327/full/v20/i46/17416.htm
- DOI: https://dx.doi.org/10.3748/wjg.v20.i46.17416


