Copyright
©2014 Baishideng Publishing Group Inc.
World J Gastroenterol. Dec 14, 2014; 20(46): 17376-17387
Published online Dec 14, 2014. doi: 10.3748/wjg.v20.i46.17376
Published online Dec 14, 2014. doi: 10.3748/wjg.v20.i46.17376
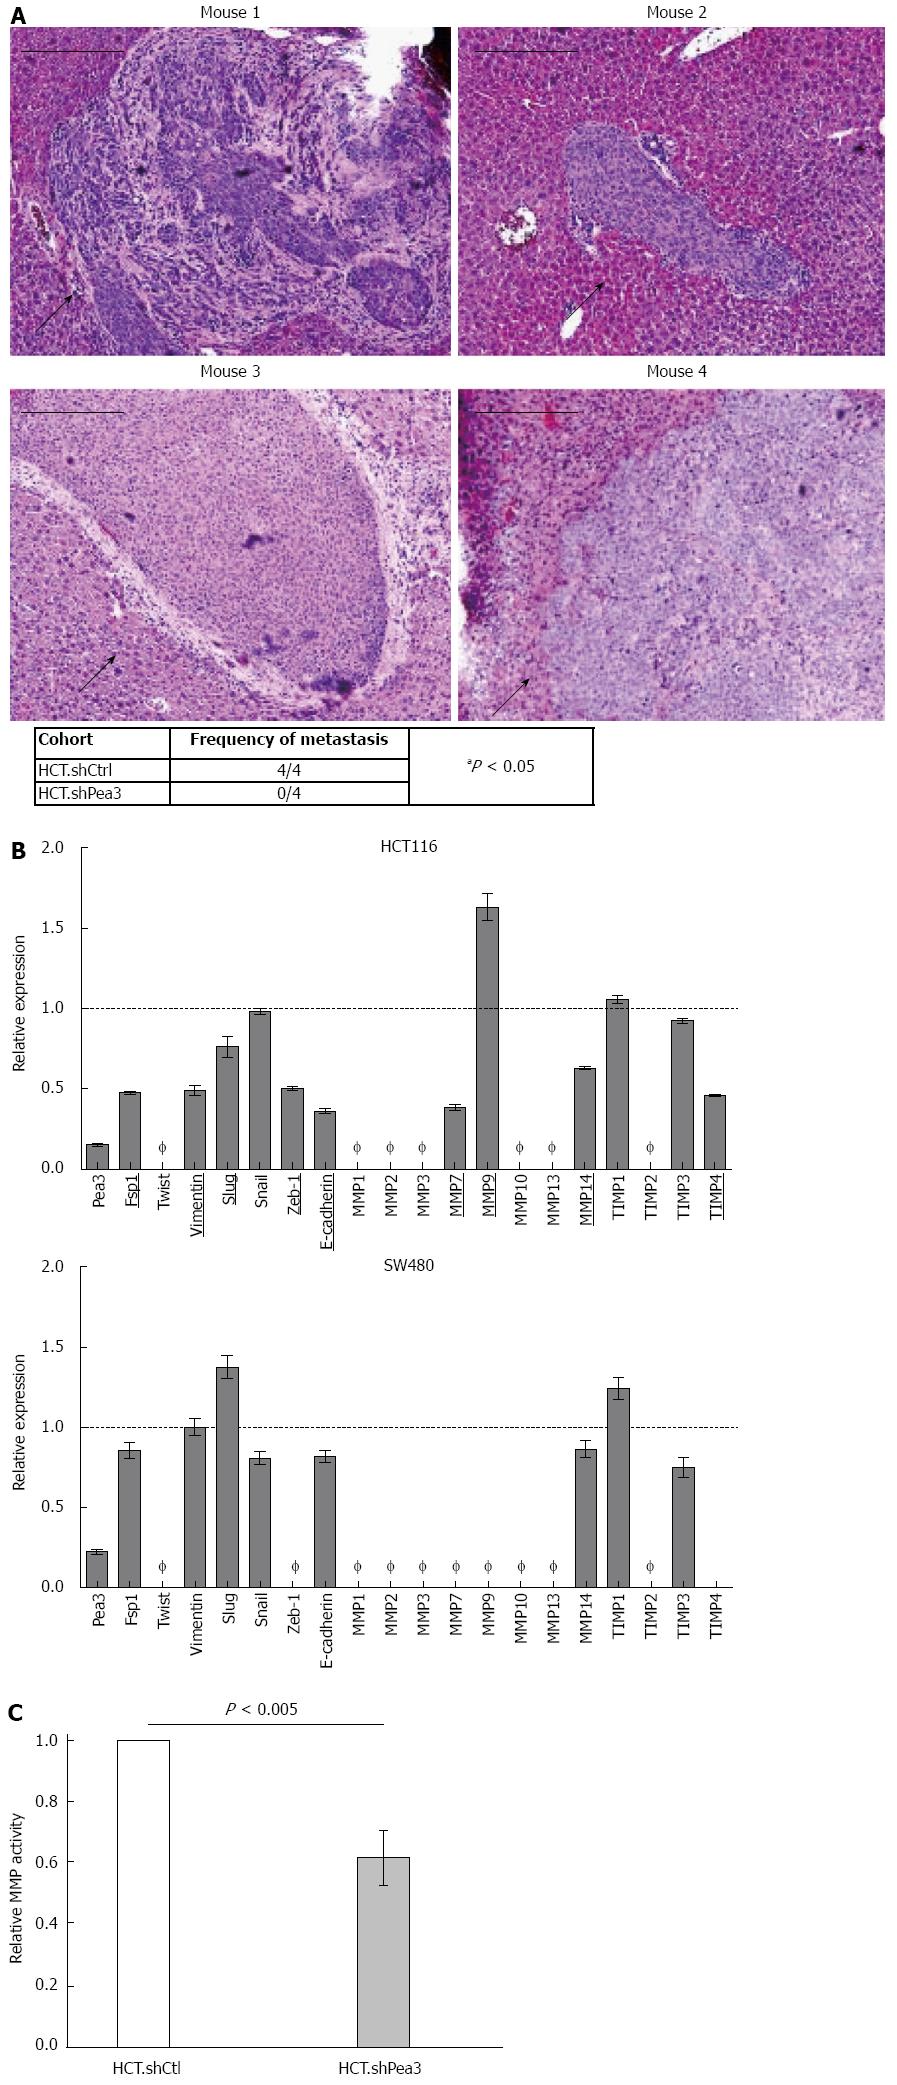
Figure 4 In vivo xenograft assay for the formation of liver metastases by HCT.
shPea3 cells, and differential expression of epithelial-mesenchymal transition markers and matrix metalloproteases. A: Ten million HCT cells were injected into spleens of athymic nude mice (4 per group), and livers were analyzed by immunohistochemistry (haematoxylin and eosin) at 21-d post injection. Representative images of metastases from the HCT.shCtrl cohort. Black arrows indicate the metastatic mass. Scale bar indicates 200 μm. Summary of the metastases observed in the shPea3 vs shCtrl cohort. Result of the χ2 test is shown; B: qPCR analysis of select epithelial-mesenchymal transition markers and a panel of MMP transcripts in HCT116 (top panel) or SW480 cells (bottom panel). Obtained ∆Ct values are normalized to GAPDH values, and expression is shown as fold change in Pea3 expression relative to cells expressing control shCtrl. Ø indicates expression is below detection threshold (Ct > 32 cycles). Targets that display differential expression between shPea3 and shCtrl consistently of at least 20% are underlined and bolded. Dashed horizontal line indicates the expression of the shCtrl cohort. Representative of three independent experiments; C: Results of the generic MMP activity assay, given as relative light units normalized to the amount of total protein in the sample. Data shown as fold change in MMP activity of HCT.shPea3 expressing cells relative to HCT.shCtrl. Representative of four independent experiments. MMP: Matrix metalloproteases.
- Citation: Mesci A, Taeb S, Huang X, Jairath R, Sivaloganathan D, Liu SK. Pea3 expression promotes the invasive and metastatic potential of colorectal carcinoma. World J Gastroenterol 2014; 20(46): 17376-17387
- URL: https://www.wjgnet.com/1007-9327/full/v20/i46/17376.htm
- DOI: https://dx.doi.org/10.3748/wjg.v20.i46.17376


