Copyright
©2014 Baishideng Publishing Group Inc.
World J Gastroenterol. Dec 14, 2014; 20(46): 17376-17387
Published online Dec 14, 2014. doi: 10.3748/wjg.v20.i46.17376
Published online Dec 14, 2014. doi: 10.3748/wjg.v20.i46.17376
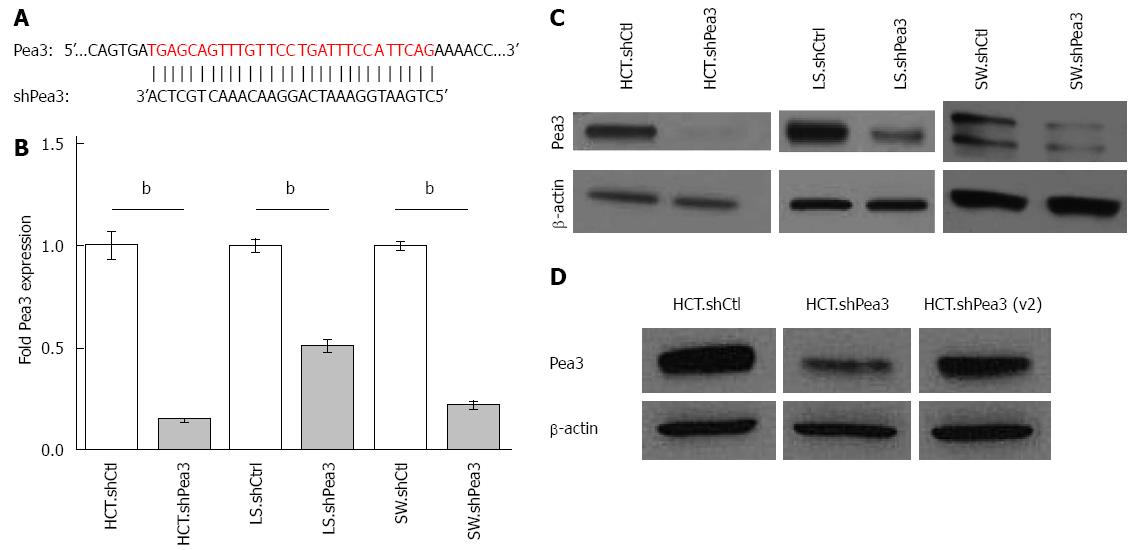
Figure 2 Generation and characterization of short hairpin RNA (shRNA)-mediated interference with Pea3 expression.
A: Nucleotide alignment of Pea3 sequence with shRNA. The shown Pea3 sequence is identical in four published Pea3 splice variants (accession numbers NM_001986.2, NM_001079675.1, NM_001261437.1 and NM_001261438.1). Vertical lines indicate complementary bases; B: Quantitative polymerase chain reaction (qPCR) analysis of Pea3 expression in HCT116, LS174T, and SW480 cells expressing Pea3-specific shRNA (HCT.shPea3, LS.shPea3, and SW.shPea3) or control shRNA (HCT.shCtrl, LS.shCtrl, and SW.shCtrl). Obtained ∆Ct values are normalized to Glyceraldehyde 3-phosphate dehydrogenase (GAPDH) values, and expression is shown as fold change in Pea3 expression relative to cells expressing control shCtrl, bP < 0.01 vs control shRNA; C: Western blot analysis of Pea3 expression in HCT116, LS174T and SW480 cells expressing Pea3-specific shRNA (HCT.shPea3, LS.shPea3, and SW.shPea3) or control shRNA (HCT.shCtrl, LS.shCtrl, and SW.shCtrl). Shown are blots for Pea3 and β-actin loading control. Representative of three independent experiments; D: Western blot analysis of Pea3 expression in HCT116 cells expressing two different Pea3-specific shRNA [HCT.shPea3 and HCT.shPea3(v2)] or control shRNA (HCT.shCtrl). Shown are blots for Pea3 and β-actin loading control. Representative of three independent experiments.
- Citation: Mesci A, Taeb S, Huang X, Jairath R, Sivaloganathan D, Liu SK. Pea3 expression promotes the invasive and metastatic potential of colorectal carcinoma. World J Gastroenterol 2014; 20(46): 17376-17387
- URL: https://www.wjgnet.com/1007-9327/full/v20/i46/17376.htm
- DOI: https://dx.doi.org/10.3748/wjg.v20.i46.17376


