Copyright
©2014 Baishideng Publishing Group Inc.
World J Gastroenterol. Dec 14, 2014; 20(46): 17376-17387
Published online Dec 14, 2014. doi: 10.3748/wjg.v20.i46.17376
Published online Dec 14, 2014. doi: 10.3748/wjg.v20.i46.17376
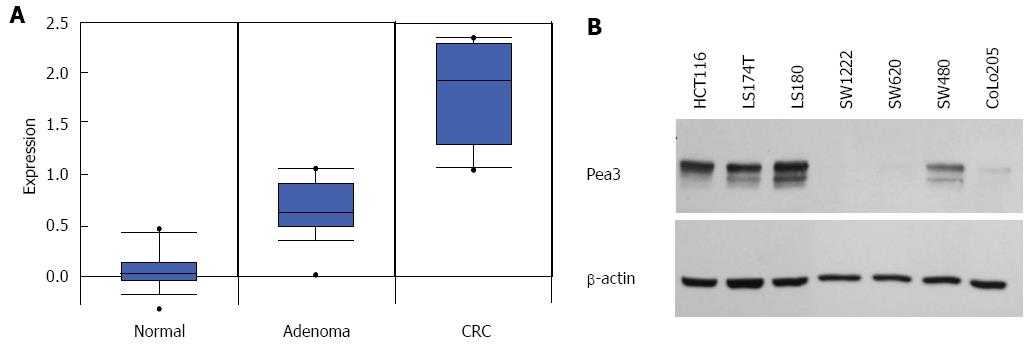
Figure 1 Pea3 expression in normal-adenoma-carcinoma (colon) and human colorectal carcinoma cell lines.
A: Box plot of Pea3 transcript expression in normal colon tissue, adenoma, and adenocarcinoma samples. Oncomine™ compendium was utilized for analysis (Skrzypczak 2 colon sample set). Expression is shown as log2 transformation of median-centered intensity. Black line represents the median; blue box, 25/75 percentile; bars, 10/90 percentile; dots, minimum and maximum values; B: Western blot analysis of Pea3 expression in human colorectal cancer cell lines. Shown are blots for Pea3 and β-actin loading control. Representative of three independent experiments.
- Citation: Mesci A, Taeb S, Huang X, Jairath R, Sivaloganathan D, Liu SK. Pea3 expression promotes the invasive and metastatic potential of colorectal carcinoma. World J Gastroenterol 2014; 20(46): 17376-17387
- URL: https://www.wjgnet.com/1007-9327/full/v20/i46/17376.htm
- DOI: https://dx.doi.org/10.3748/wjg.v20.i46.17376


