Copyright
©2014 Baishideng Publishing Group Inc.
World J Gastroenterol. Dec 14, 2014; 20(46): 17345-17351
Published online Dec 14, 2014. doi: 10.3748/wjg.v20.i46.17345
Published online Dec 14, 2014. doi: 10.3748/wjg.v20.i46.17345
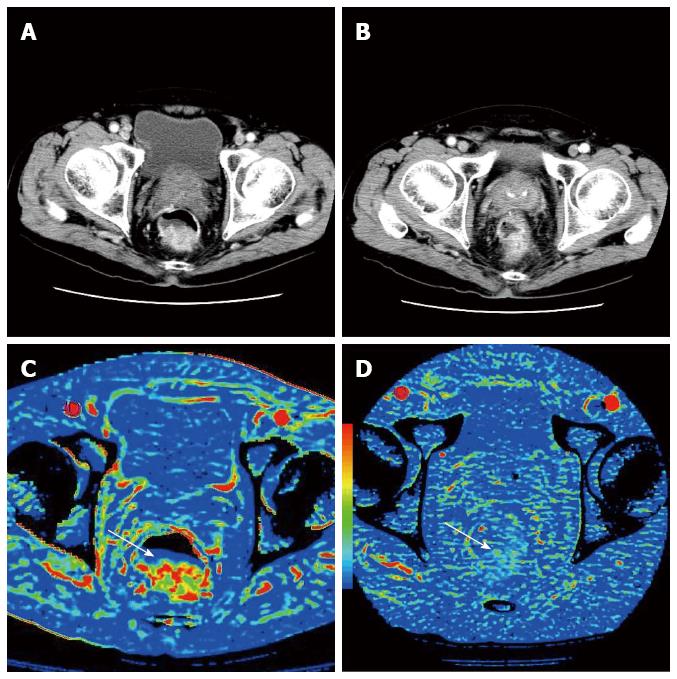
Figure 1 Perfusion change after chemoraditaion therapy.
Contrast enhanced CT images at baseline (A) and post-CRT (B). BF maps at baseline (C) and post-CRT (D). After CRT, tumor showed significant decrease in BF (arrows). CRT: Chemoraditaion therapy; CT: Computed tomography; BF: Blood flow.
- Citation: Hayano K, Fujishiro T, Sahani DV, Satoh A, Aoyagi T, Ohira G, Tochigi T, Matsubara H, Shuto K. Computed tomography perfusion imaging as a potential imaging biomarker of colorectal cancer. World J Gastroenterol 2014; 20(46): 17345-17351
- URL: https://www.wjgnet.com/1007-9327/full/v20/i46/17345.htm
- DOI: https://dx.doi.org/10.3748/wjg.v20.i46.17345


