Copyright
©2014 Baishideng Publishing Group Inc.
World J Gastroenterol. Dec 7, 2014; 20(45): 17065-17074
Published online Dec 7, 2014. doi: 10.3748/wjg.v20.i45.17065
Published online Dec 7, 2014. doi: 10.3748/wjg.v20.i45.17065
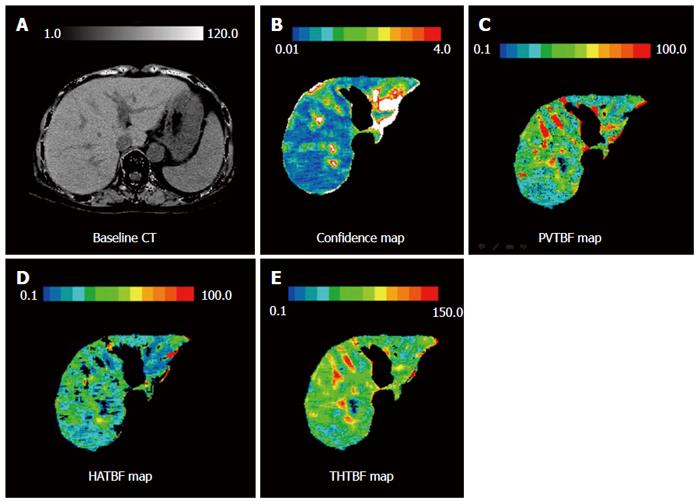
Figure 3 Measurement of hepatic tissue blood flow and confidence values obtained using xenon computed tomography.
A: Baseline computed tomography; B: Confidence map. The original blood flow maps were modified by automatically excluding any pixels with confidence values exceeding the threshold in the confidence map. The white areas on the confidence map indicate regions of low reliability and were automatically excluded. Confidence values indicate the difference between theoretical and actual changes over time on xenon computed tomography (Xe-CT); C: Portal tissue blood flow (PVTBF) map; D: Hepatic arterial tissue blood flow (HATBF) map; E: Total hepatic tissue blood flow (THTBF) map. Maps were created for portal venous TBF (PVTBF; C), hepatic arterial TBF (HATBF; D), the Xe solubility coefficient, and confidence values for each pixel in the liver based on changes over time in the Xe-CT numbers in the hepatic tissue and spleen.
- Citation: Takahashi H, Shigefuku R, Yoshida Y, Ikeda H, Matsunaga K, Matsumoto N, Okuse C, Sase S, Itoh F, Suzuki M. Correlation between hepatic blood flow and liver function in alcoholic liver cirrhosis. World J Gastroenterol 2014; 20(45): 17065-17074
- URL: https://www.wjgnet.com/1007-9327/full/v20/i45/17065.htm
- DOI: https://dx.doi.org/10.3748/wjg.v20.i45.17065


