Copyright
©2014 Baishideng Publishing Group Inc.
World J Gastroenterol. Dec 7, 2014; 20(45): 17049-17064
Published online Dec 7, 2014. doi: 10.3748/wjg.v20.i45.17049
Published online Dec 7, 2014. doi: 10.3748/wjg.v20.i45.17049
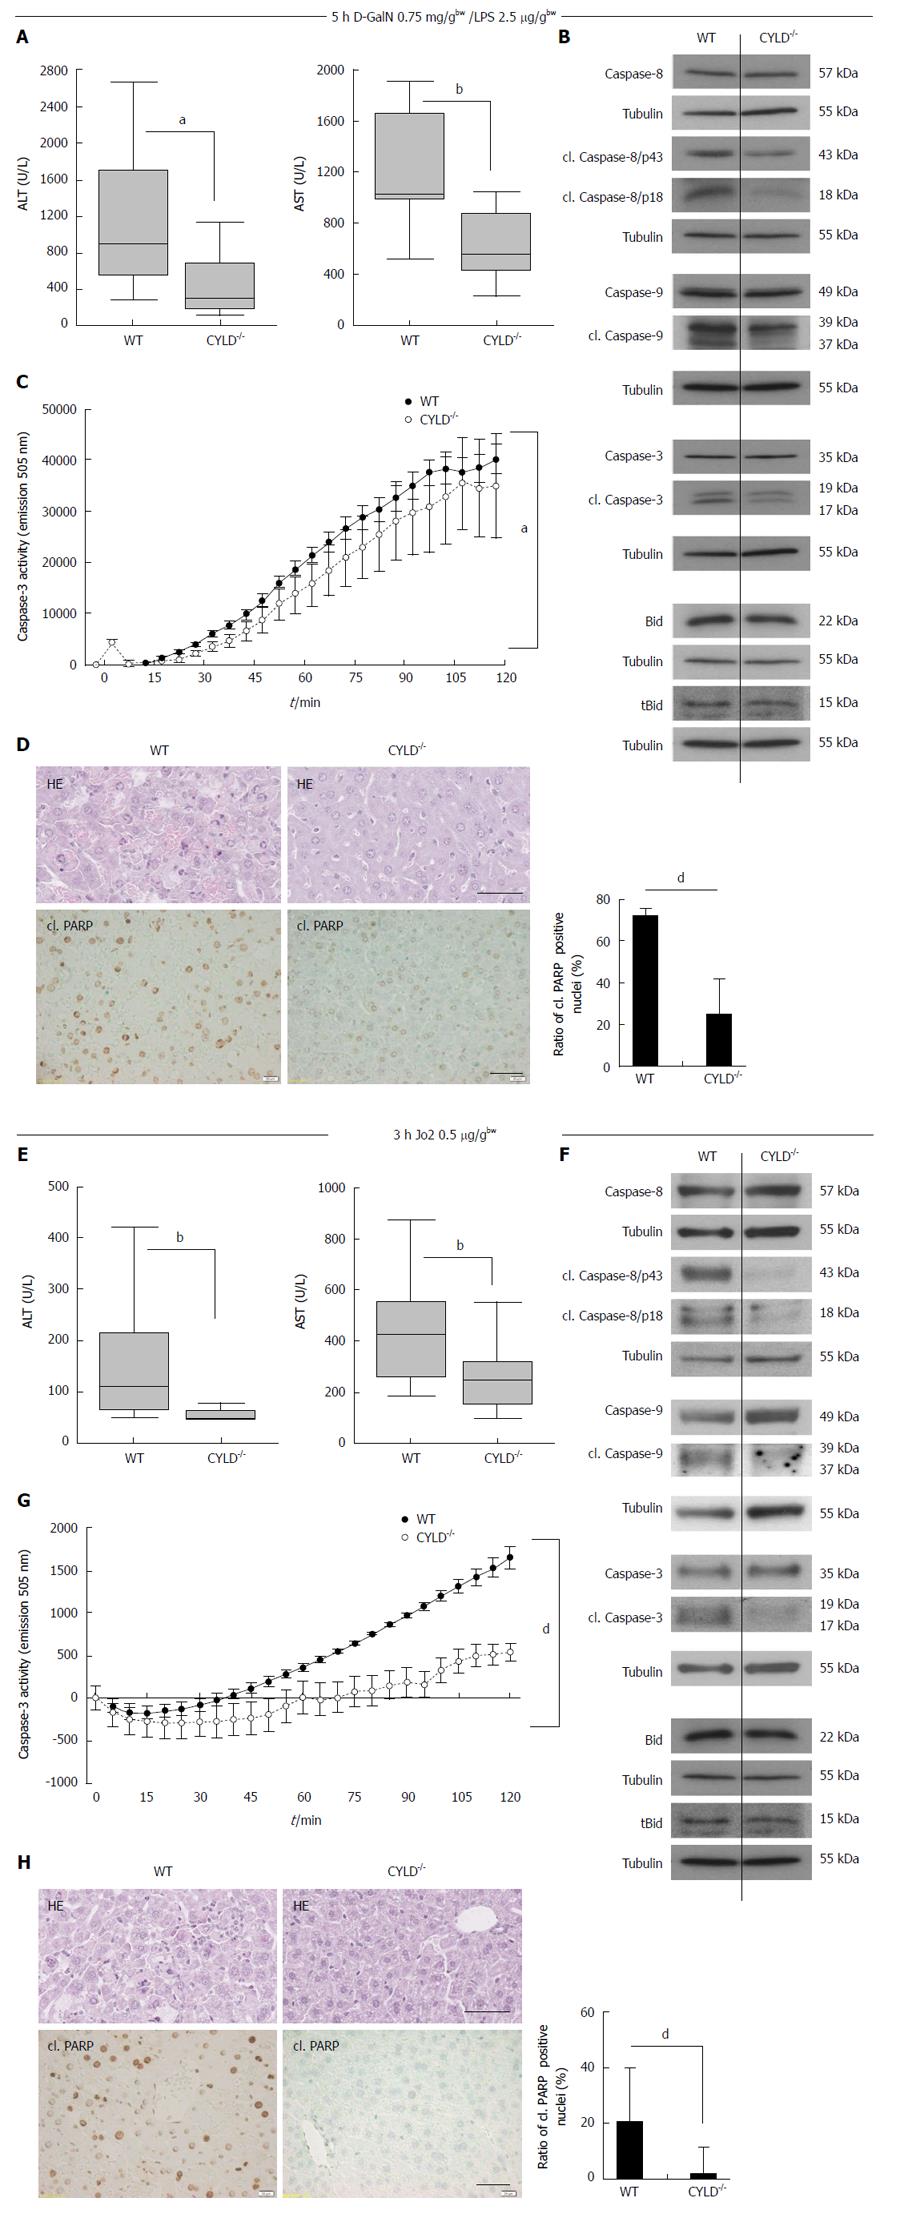
Figure 2 Decreased liver injury in CYLD-/- mice after D-galactosamine/lipopolysaccharide and Jo2 treatment.
A: Box-plots of serum transaminases alanine aminotransferase (ALT) (left panel) and aspartate aminotransferase (AST) (right panel) levels 5 h after D-galactosamine (D-GalN)/lipopolysaccharide (LPS) injection. n = 10 vs 10; B: Western blot analysis of caspase and Bid activation in pooled liver lysates from D-GalN/LPS treated WT and CYLD-/- mice; C: Caspase-3 activity assays of pooled liver lysates from D-GalN/LPS treated WT and CYLD-/- mice. Caspase-3 substrate turnover was measured by fluorometric analysis at the indicated time points; D: WT mice showed more single cell necrosis and apoptosis compared to CYLD-/- mice (HE). Representative immunohistological stainings of cl. PARP (Scale bar: 40 μm) and quantification of cl. PARP positive nuclei. Values represent the mean ± SD; E: Box plots of serum transaminases ALT (left panel) and AST (right panel) levels 3 h after Jo2 injection. n = 10 vs 10; F: Western blot analysis of caspase and Bid activation in pooled liver lysates from Jo2 treated WT and CYLD-/- mice. (G) Caspase-3 activity assays of pooled liver lysates from Jo2 treated WT and CYLD-/- mice. Caspase-3 substrate turnover was measured by fluorometric analysis at the indicated time points; H: Liver cell damage was increased in WT compared to CYLD-/- (HE). Representative immunohistological stainings of cl. PARP (Scale bar: 40 μm) and quantification of cl. PARP positive nuclei. Values represent the mean ± SD. aP < 0.05, WT vs CYLD-/-; bP < 0.01, WT vs CYLD-/-; dP < 0.01, WT vs CYLD-/-.
- Citation: Urbanik T, Koehler BC, Wolpert L, Elßner C, Scherr AL, Longerich T, Kautz N, Welte S, Hövelmeyer N, Jäger D, Waisman A, Schulze-Bergkamen H. CYLD deletion triggers nuclear factor-κB-signaling and increases cell death resistance in murine hepatocytes. World J Gastroenterol 2014; 20(45): 17049-17064
- URL: https://www.wjgnet.com/1007-9327/full/v20/i45/17049.htm
- DOI: https://dx.doi.org/10.3748/wjg.v20.i45.17049


