Copyright
©2014 Baishideng Publishing Group Inc.
World J Gastroenterol. Nov 28, 2014; 20(44): 16714-16720
Published online Nov 28, 2014. doi: 10.3748/wjg.v20.i44.16714
Published online Nov 28, 2014. doi: 10.3748/wjg.v20.i44.16714
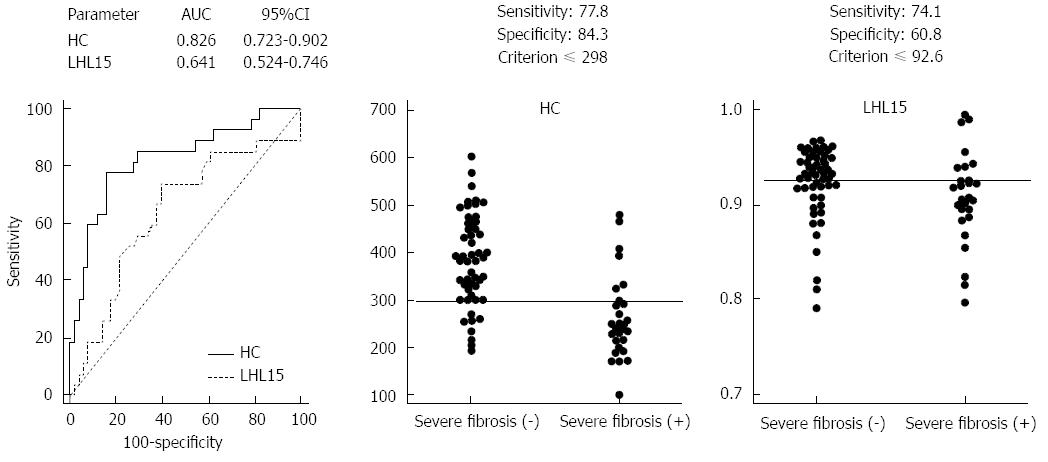
Figure 1 Receiver operating characteristic curve and interactive dot diagrams of hepatic clearance and LHL15 for the diagnosis of severe fibrosis.
A: ROC analysis for HC and LHL15. There was a significant difference between the two values (P = 0.0146); B: Interactive dot diagrams showing HC predicts severe cirrhosis. The cutoff value for predicting severe cirrhosis with the highest sensitivity and specificity was 298 (sensitivity, 77.8%; specificity, 84.3%) for HC. The horizontal line indicates the cutoff point with the best separation between the 2 groups (severe fibrosis+, severe fibrosis-); C: Interactive dot diagrams showing LHL15 predicts severe cirrhosis. The cutoff value for predicting severe cirrhosis with the highest sensitivity and specificity was 0.926 (sensitivity, 74.1%; specificity, 60.8%) for LHL15. The horizontal line indicates the cutoff point with the best separation between the 2 groups (severe fibrosis+, severe fibrosis-). AUC: Area under the ROC curve; ROC: Receiver operating characteristic; HC: Hepatic clearance.
- Citation: Taniguchi M, Okizaki A, Watanabe K, Imai K, Uchida K, Einama T, Shuke N, Miyokawa N, Furukawa H. Hepatic clearance measured with 99mTc-GSA single-photon emission computed tomography to estimate liver fibrosis. World J Gastroenterol 2014; 20(44): 16714-16720
- URL: https://www.wjgnet.com/1007-9327/full/v20/i44/16714.htm
- DOI: https://dx.doi.org/10.3748/wjg.v20.i44.16714


