Copyright
©2014 Baishideng Publishing Group Inc.
World J Gastroenterol. Nov 28, 2014; 20(44): 16690-16697
Published online Nov 28, 2014. doi: 10.3748/wjg.v20.i44.16690
Published online Nov 28, 2014. doi: 10.3748/wjg.v20.i44.16690
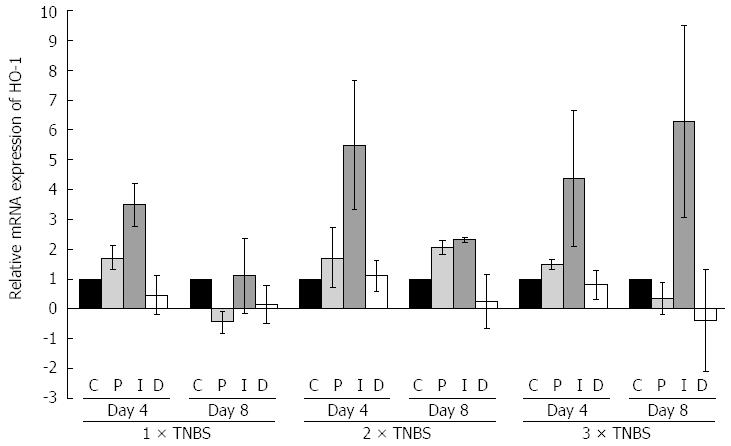
Figure 4 Relative mRNA expression of heme oxygenase-1 compared to the controls (n = 12) (C) in the inflamed segment (I) and the adjacent proximal (P) and distal (D) colonic segments four (n = 13) and eight (n = 14) days after TNBS treatments.
Irrespectively of the number of treatments (1 × TNBS, 2 × TNBS, 3 × TNBS), the HO-1 expression was always marked on day four in the I segments and a more limited expression was also detected in the P but not in the D colonic segments. After the first and second TNBS administrations the rate of HO-1 gene expression decreased, but never returned to baseline level up to day eight post-induction. Nevertheless, after the third TNBS treatment the high level of HO-1 expression was not merely sustained: a pronounced further increase was demonstrated until day eight post-induction. Data are expressed as means ± SD. TNBS: 2,4,6-trinitrobenzenesulfonic acid; HO-1: Heme oxygenase-1.
- Citation: Talapka P, Nagy LI, Pál A, Poles MZ, Berkó A, Bagyánszki M, Puskás LG, Fekete &, Bódi N. Alleviated mucosal and neuronal damage in a rat model of Crohn’s disease. World J Gastroenterol 2014; 20(44): 16690-16697
- URL: https://www.wjgnet.com/1007-9327/full/v20/i44/16690.htm
- DOI: https://dx.doi.org/10.3748/wjg.v20.i44.16690


