Copyright
©2014 Baishideng Publishing Group Inc.
World J Gastroenterol. Nov 7, 2014; 20(41): 15398-15412
Published online Nov 7, 2014. doi: 10.3748/wjg.v20.i41.15398
Published online Nov 7, 2014. doi: 10.3748/wjg.v20.i41.15398
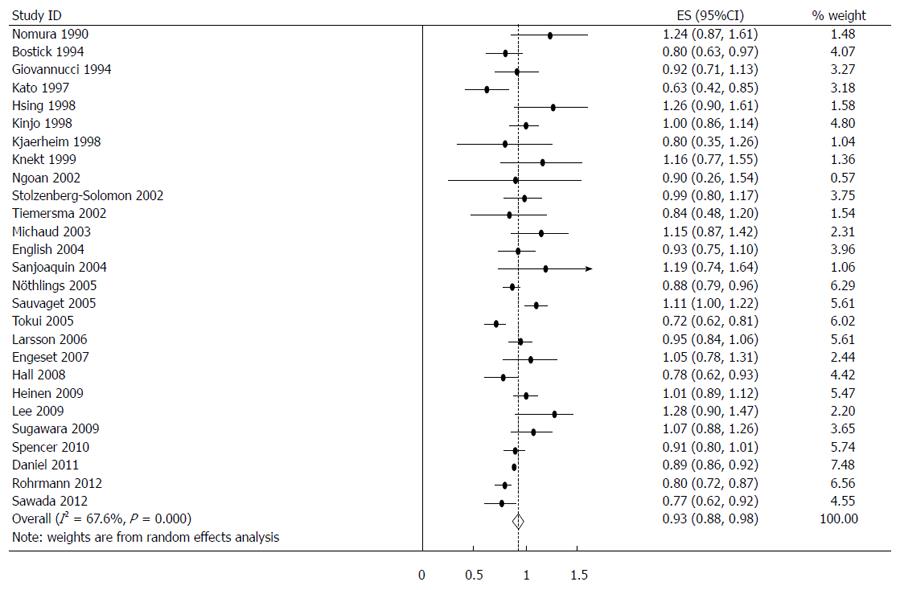
Figure 2 Summary relative risks of gastrointestinal cancer for fish consumers vs non/lowest consumers from all included studies.
Squares represent study-specific relative risk estimates (size of the square reflects the study-specific statistical weight; i.e., the inverse of the variance); horizontal lines represent 95%CI; diamonds represent summary relative risk estimates with corresponding 95%CI.
- Citation: Yu XF, Zou J, Dong J. Fish consumption and risk of gastrointestinal cancers: A meta-analysis of cohort studies. World J Gastroenterol 2014; 20(41): 15398-15412
- URL: https://www.wjgnet.com/1007-9327/full/v20/i41/15398.htm
- DOI: https://dx.doi.org/10.3748/wjg.v20.i41.15398


