Copyright
©2014 Baishideng Publishing Group Inc.
World J Gastroenterol. Nov 7, 2014; 20(41): 15070-15078
Published online Nov 7, 2014. doi: 10.3748/wjg.v20.i41.15070
Published online Nov 7, 2014. doi: 10.3748/wjg.v20.i41.15070
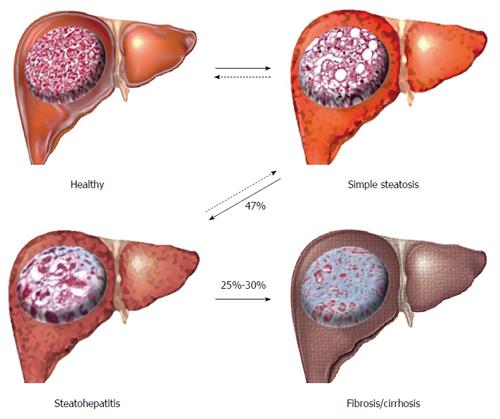
Figure 1 Progression and stages of non-alcoholic fatty liver disease.
Livers, representing macroscopic changes with inserted micrographs of histological sections; collagen fibres stained with Masson’s trichrome stain (blue). Arrows represent disease progression/regression (dashed).
- Citation: Fisher CP, Kierzek AM, Plant NJ, Moore JB. Systems biology approaches for studying the pathogenesis of non-alcoholic fatty liver disease. World J Gastroenterol 2014; 20(41): 15070-15078
- URL: https://www.wjgnet.com/1007-9327/full/v20/i41/15070.htm
- DOI: https://dx.doi.org/10.3748/wjg.v20.i41.15070


