Copyright
©2014 Baishideng Publishing Group Inc.
World J Gastroenterol. Oct 28, 2014; 20(40): 15001-15006
Published online Oct 28, 2014. doi: 10.3748/wjg.v20.i40.15001
Published online Oct 28, 2014. doi: 10.3748/wjg.v20.i40.15001
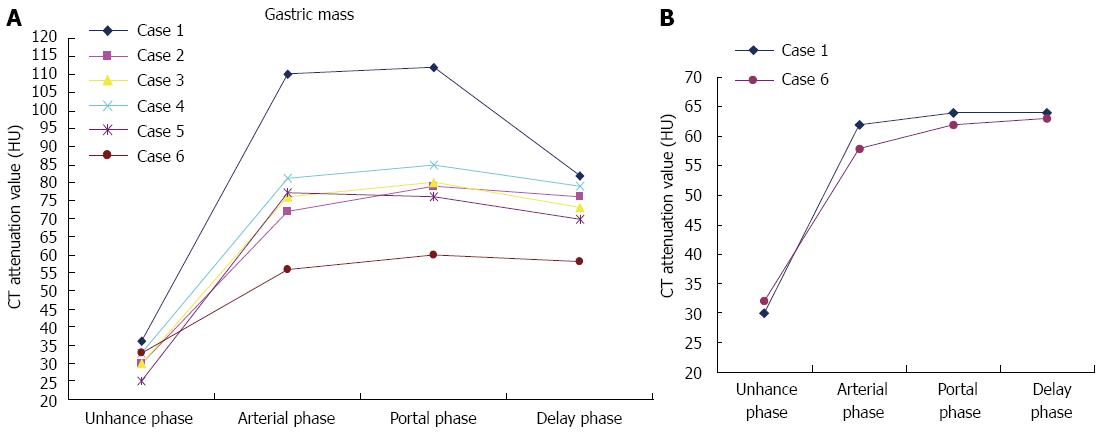
Figure 5 Time-density curve of gastric lesion and venous tumor thrombus.
A: The mean attenuation of the gastric lesion showed a peak in the arterial phase and persistent enhancement without absolute loss of enhancement in the portal and delayed phases; B: The graph shows a slight enhancement of tumor thrombus with a similar enhancement pattern to that of hepatoid adenocarcinoma of the stomach. CT: Computed tomography.
- Citation: Ren A, Cai F, Shang YN, Ma ES, Huang ZG, Wang W, Luo J. Gastric hepatoid adenocarcinoma: A computed tomography report of six cases. World J Gastroenterol 2014; 20(40): 15001-15006
- URL: https://www.wjgnet.com/1007-9327/full/v20/i40/15001.htm
- DOI: https://dx.doi.org/10.3748/wjg.v20.i40.15001


