Copyright
©2014 Baishideng Publishing Group Inc.
World J Gastroenterol. Oct 28, 2014; 20(40): 14686-14695
Published online Oct 28, 2014. doi: 10.3748/wjg.v20.i40.14686
Published online Oct 28, 2014. doi: 10.3748/wjg.v20.i40.14686
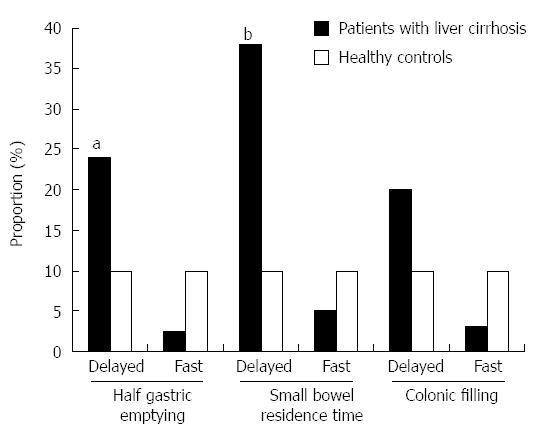
Figure 3 Frequency of transit abnormalities in patients with liver cirrhosis (black bars, n = 42) and healthy controls (white bars, n = 83).
Reference values were based on percentiles 10 and 90 of the transit values of healthy controls (n = 83) aP < 0.05, bP < 0.01 vs healthy controls. Adapted from the reference [76].
- Citation: Kalaitzakis E. Gastrointestinal dysfunction in liver cirrhosis. World J Gastroenterol 2014; 20(40): 14686-14695
- URL: https://www.wjgnet.com/1007-9327/full/v20/i40/14686.htm
- DOI: https://dx.doi.org/10.3748/wjg.v20.i40.14686


