Copyright
©2014 Baishideng Publishing Group Co.
World J Gastroenterol. Jan 28, 2014; 20(4): 1054-1060
Published online Jan 28, 2014. doi: 10.3748/wjg.v20.i4.1054
Published online Jan 28, 2014. doi: 10.3748/wjg.v20.i4.1054
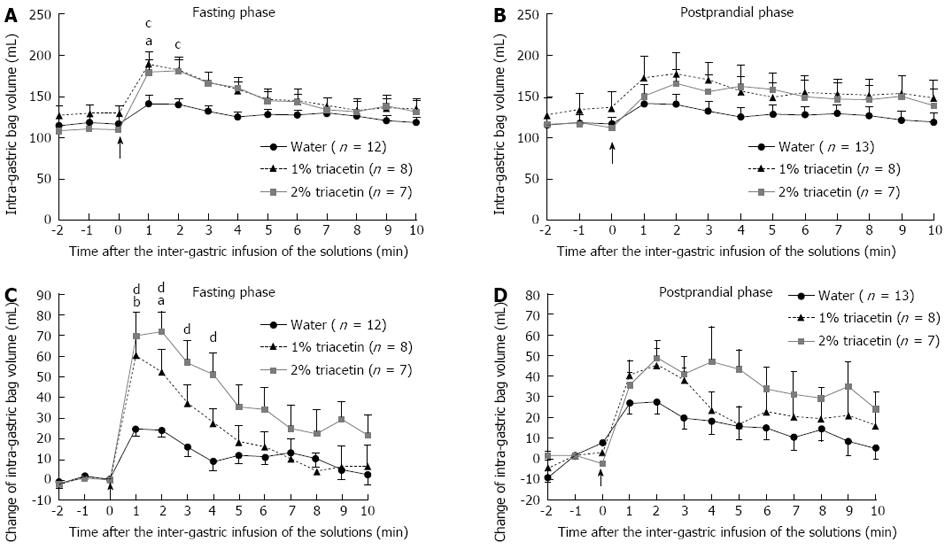
Figure 2 Effect of triacetin on the proximal gastric tone in fasting and postprandial phases.
The receptive volume (representative of gastric tone) before and after infusion in fasted (A, C) and fed (B, D) animals is presented. Data are expressed as mean ± SE (A, B) aP < 0.05 for 1% triacetin, cP < 0.05 for 2% triacetin vs before infusion. (C, D) aP < 0.05, bP < 0.01 for 1% triacetin vs water; cP < 0.05, dP < 0.01 for 2% triacetin vs water. The point of infusion is indicated by an arrow.
- Citation: Oosaka K, Tokuda M, Furukawa N. Intra-gastric triacetin alters upper gastrointestinal motility in conscious dogs. World J Gastroenterol 2014; 20(4): 1054-1060
- URL: https://www.wjgnet.com/1007-9327/full/v20/i4/1054.htm
- DOI: https://dx.doi.org/10.3748/wjg.v20.i4.1054


