Copyright
©2014 Baishideng Publishing Group Co.
World J Gastroenterol. Jan 28, 2014; 20(4): 1021-1029
Published online Jan 28, 2014. doi: 10.3748/wjg.v20.i4.1021
Published online Jan 28, 2014. doi: 10.3748/wjg.v20.i4.1021
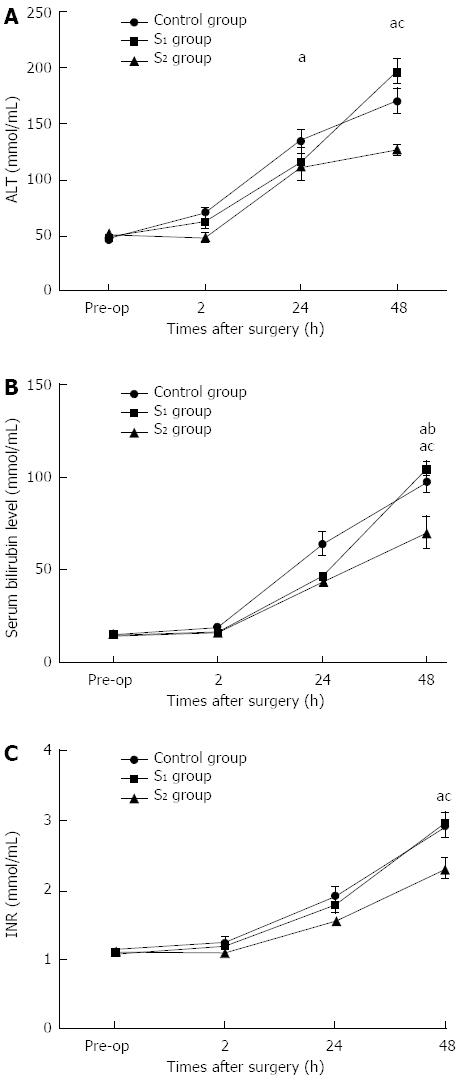
Figure 2 Changes in serum alanine aminotransferase, total bilirubin and international normalized ratio values.
A: Alanine aminotransferase (ALT); B: Total bilirubin; C: International normalized ratio (INR). aP < 0.05 for comparison between S1 and control groups; cP < 0.05 for comparison between S2 and S1 groups.
- Citation: Wang XQ, Xu YF, Tan JW, Lv WP, Liu Z, Zeng JP, Dong JH. Portal inflow preservation during portal diversion in small-for-size syndrome. World J Gastroenterol 2014; 20(4): 1021-1029
- URL: https://www.wjgnet.com/1007-9327/full/v20/i4/1021.htm
- DOI: https://dx.doi.org/10.3748/wjg.v20.i4.1021


