Copyright
©2014 Baishideng Publishing Group Inc.
World J Gastroenterol. Oct 14, 2014; 20(38): 13930-13935
Published online Oct 14, 2014. doi: 10.3748/wjg.v20.i38.13930
Published online Oct 14, 2014. doi: 10.3748/wjg.v20.i38.13930
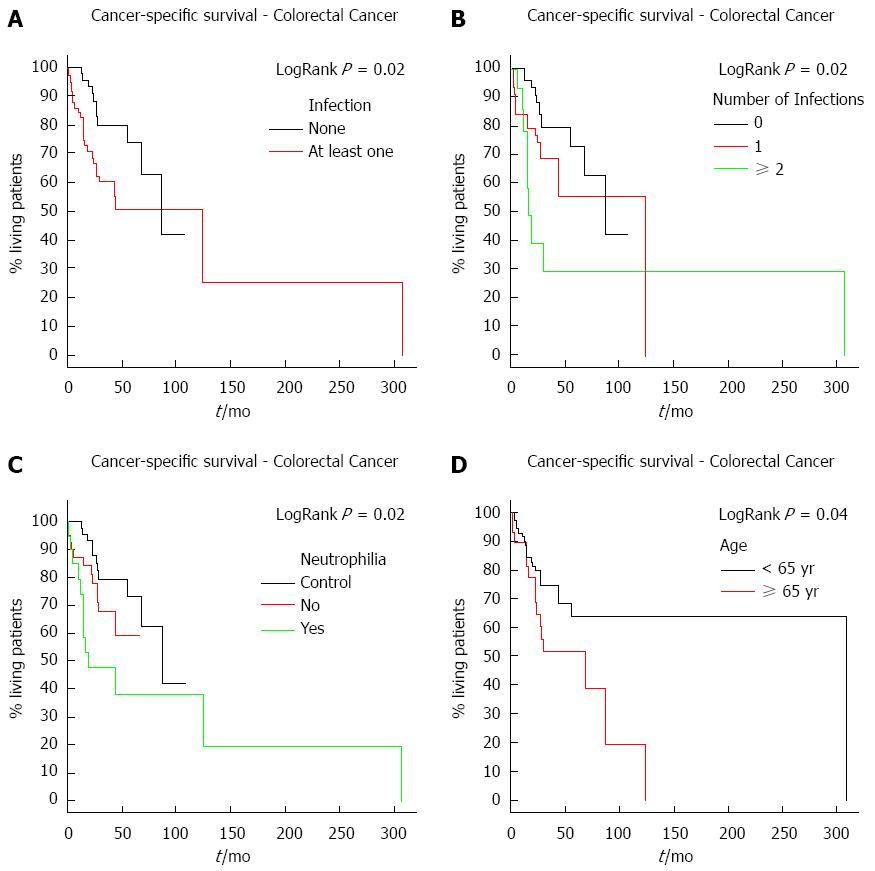
Figure 1 Cancer specific survival.
Curves were calculated by Kaplan-Meier method and compared log-rank test. A: Cancer specific survival according to the occurrence of infection in colorectal cancer patients. The red line corresponds to patients who had at least one infection and the black line to those who did not have any infection; B: Cancer specific survival in colorectal cancer patients, according to the number of infections. The red line refers to patients who had one infection only, the green line to those who had two or more infections and the black line to patients who did not have any infection; C: Cancer specific survival in colorectal cancer patients according to the presence or absence of neutrophilia. The red line refers to those patients who did not develop neutrophilia, the green line corresponds to those who developed neutrophilia and the black line refers to patients from the control group; D: Cancer specific survival according to age for colorectal cancer. The black line corresponds to the patients under 65 years and red line corresponds to the patients with age equal or greater than 65 years.
- Citation: Attiê R, Chinen LTD, Yoshioka EM, Silva MCF, de Lima VCC. Acute bacterial infection negatively impacts cancer specific survival of colorectal cancer patients. World J Gastroenterol 2014; 20(38): 13930-13935
- URL: https://www.wjgnet.com/1007-9327/full/v20/i38/13930.htm
- DOI: https://dx.doi.org/10.3748/wjg.v20.i38.13930


