Copyright
©2014 Baishideng Publishing Group Inc.
World J Gastroenterol. Oct 7, 2014; 20(37): 13546-13555
Published online Oct 7, 2014. doi: 10.3748/wjg.v20.i37.13546
Published online Oct 7, 2014. doi: 10.3748/wjg.v20.i37.13546
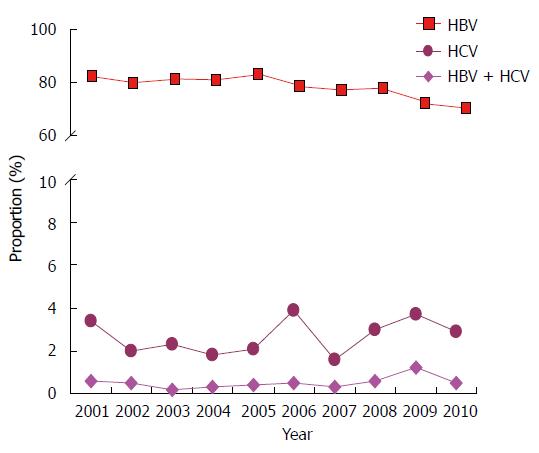
Figure 3 Changing trends in the proportion of subgroups of viral hepatitis over 10 consecutive years.
The proportion of HBV-induced LC has decreased gradually over the 10 years, and those of HCV- and (HBV + HCV)-induced LC have not exhibited explicit trends. Every marker illustrates the proportion of LC due to a different cause, and the changing trend is simulated by lining up the markers for each etiology as different colored lines. HBV: LC caused by hepatitis B virus, P < 0.001 in 10 years comparison; HCV: LC caused by hepatitis C virus, P = 0.263 in 10 years comparison; HBV + HCV: LC caused by hepatitis B virus combined with hepatitis C virus, P = 0.267 in 10 years comparison. LC: Liver cirrhosis; HBV: Hepatitis B virus; HCV: Hepatitis C virus.
- Citation: Wang X, Lin SX, Tao J, Wei XQ, Liu YT, Chen YM, Wu B. Study of liver cirrhosis over ten consecutive years in Southern China. World J Gastroenterol 2014; 20(37): 13546-13555
- URL: https://www.wjgnet.com/1007-9327/full/v20/i37/13546.htm
- DOI: https://dx.doi.org/10.3748/wjg.v20.i37.13546


