Copyright
©2014 Baishideng Publishing Group Inc.
World J Gastroenterol. Sep 21, 2014; 20(35): 12533-12541
Published online Sep 21, 2014. doi: 10.3748/wjg.v20.i35.12533
Published online Sep 21, 2014. doi: 10.3748/wjg.v20.i35.12533
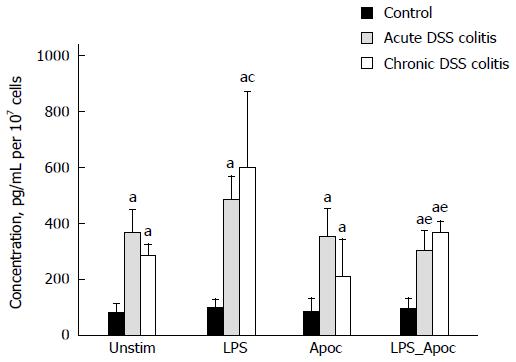
Figure 5 Assessment of TNF-α production by mouse colonic epithelial cells.
TNF-α concentration was measured in cell media after 24 h incubation with 20 μg/mL of LPS, 1 mmol/L of apocynin (Apoc), 20 μg/mL LPS + 1 mmol/L Apoc or without stimulation; aP < 0.05, DSS-induced colitis groups in all subgroups vs control; cP < 0.05, untreated vs LPS treated subgroup in the chronic DSS-induced colitis group; eP < 0.05, LPS vs LPS + apocynin treated subgroup in both DSS-induced colitis groups. Values are presented as mean ± SE. Untreated mouse group: n = 12. Both DSS-induced colitis groups: n = 8.
- Citation: Ramonaite R, Skieceviciene J, Juzenas S, Salteniene V, Kupcinskas J, Matusevicius P, Borutaite V, Kupcinskas L. Protective action of NADPH oxidase inhibitors and role of NADPH oxidase in pathogenesis of colon inflammation in mice. World J Gastroenterol 2014; 20(35): 12533-12541
- URL: https://www.wjgnet.com/1007-9327/full/v20/i35/12533.htm
- DOI: https://dx.doi.org/10.3748/wjg.v20.i35.12533


