Copyright
©2014 Baishideng Publishing Group Inc.
World J Gastroenterol. Sep 7, 2014; 20(33): 11850-11855
Published online Sep 7, 2014. doi: 10.3748/wjg.v20.i33.11850
Published online Sep 7, 2014. doi: 10.3748/wjg.v20.i33.11850
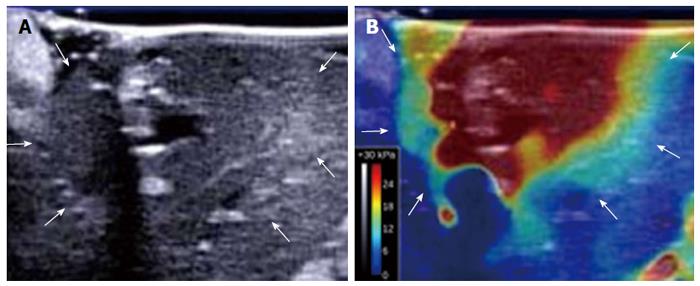
Figure 2 B-mode ultrasound image and shear-wave elastography image of a thermal lesion.
A: B-mode ultrasound image of the liver obtained 15 min after ablation shows a poorly defined hypoechoic lesion with a hyperechoic rim (arrows); B: Corresponding shear-wave elastography image of the liver clearly delineates the ablated area (arrows).
- Citation: Sugimoto K, Oshiro H, Ogawa S, Honjo M, Hara T, Moriyasu F. Radiologic-pathologic correlation of three-dimensional shear-wave elastographic findings in assessing the liver ablation volume after radiofrequency ablation. World J Gastroenterol 2014; 20(33): 11850-11855
- URL: https://www.wjgnet.com/1007-9327/full/v20/i33/11850.htm
- DOI: https://dx.doi.org/10.3748/wjg.v20.i33.11850


