Copyright
©2014 Baishideng Publishing Group Inc.
World J Gastroenterol. Sep 7, 2014; 20(33): 11762-11769
Published online Sep 7, 2014. doi: 10.3748/wjg.v20.i33.11762
Published online Sep 7, 2014. doi: 10.3748/wjg.v20.i33.11762
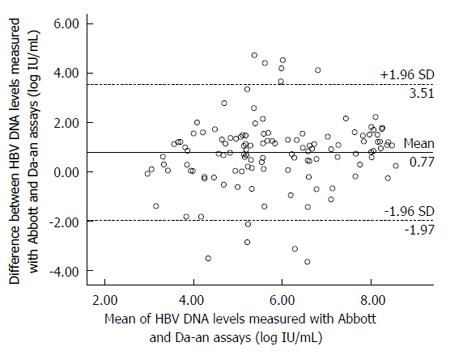
Figure 4 Bland-Altman analysis.
Bland-Altman analysis of hepatitis B virus (HBV) DNA level measured with the Abbott and Da-an assays in 126 clinical serum samples from patients with chronic hepatitis B. The difference between the Abbott and Da-an measurements is plotted as a function of the mean of the two values. The area between the dashed lines corresponds to the mean difference ± 1.96 SD.
- Citation: Qiu N, Li R, Yu JG, Yang W, Zhang W, An Y, Li T, Liu XE, Zhuang H. Comparison of Abbott and Da-an real-time PCR for quantitating serum HBV DNA. World J Gastroenterol 2014; 20(33): 11762-11769
- URL: https://www.wjgnet.com/1007-9327/full/v20/i33/11762.htm
- DOI: https://dx.doi.org/10.3748/wjg.v20.i33.11762


