Copyright
©2014 Baishideng Publishing Group Inc.
World J Gastroenterol. Sep 7, 2014; 20(33): 11762-11769
Published online Sep 7, 2014. doi: 10.3748/wjg.v20.i33.11762
Published online Sep 7, 2014. doi: 10.3748/wjg.v20.i33.11762
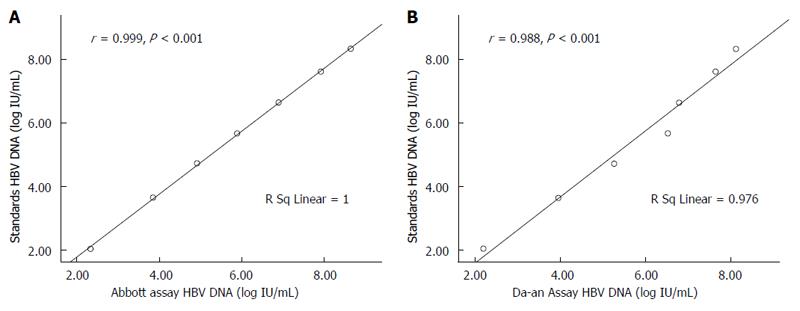
Figure 1 Correlation analysis.
Correlation analysis between the expected hepatitis B virus (HBV) DNA concentration (log IU/mL) in the sensitivity references (standards) and the corresponding test results in the Abbott (A) and Da-an (B) assays. Each point represents the mean log IU/mL of three data points tested over 3 d.
- Citation: Qiu N, Li R, Yu JG, Yang W, Zhang W, An Y, Li T, Liu XE, Zhuang H. Comparison of Abbott and Da-an real-time PCR for quantitating serum HBV DNA. World J Gastroenterol 2014; 20(33): 11762-11769
- URL: https://www.wjgnet.com/1007-9327/full/v20/i33/11762.htm
- DOI: https://dx.doi.org/10.3748/wjg.v20.i33.11762


