Copyright
©2014 Baishideng Publishing Group Inc.
World J Gastroenterol. Aug 28, 2014; 20(32): 11363-11369
Published online Aug 28, 2014. doi: 10.3748/wjg.v20.i32.11363
Published online Aug 28, 2014. doi: 10.3748/wjg.v20.i32.11363
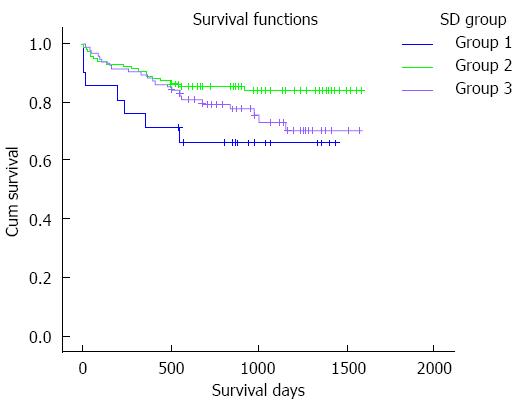
Figure 2 Patient survival curve according to the standard deviation of tacrolimus concentration.
The survival time of group 2 is obviously longer than that of other groups (group 1 vs group 2, 1029.6 ± 131.3 d vs 1388.8 ± 45.4 d, P = 0.032; group 3 vs group 2, 1274.9 ± 57.0 d vs 1388.8 ± 45.4 d, P = 0.044) while in groups 1 and 3, the rates are not statistically different (1029.6 ± 131.3 d vs 1274.9 ± 57.0 d, P = 0.286). Note: Group 1: Standard deviation (SD) of tacrolimus concentration was 0-2 ng/mL, Group 2: 2-4 ng/mL, and Group 3: > 4 ng/mL.
- Citation: Jia JJ, Lin BY, He JJ, Geng L, Kadel D, Wang L, Yu DD, Shen T, Yang Z, Ye YF, Zhou L, Zheng SS. ''Minimizing tacrolimus'' strategy and long-term survival after liver transplantation. World J Gastroenterol 2014; 20(32): 11363-11369
- URL: https://www.wjgnet.com/1007-9327/full/v20/i32/11363.htm
- DOI: https://dx.doi.org/10.3748/wjg.v20.i32.11363


