Copyright
©2014 Baishideng Publishing Group Inc.
World J Gastroenterol. Aug 28, 2014; 20(32): 11262-11272
Published online Aug 28, 2014. doi: 10.3748/wjg.v20.i32.11262
Published online Aug 28, 2014. doi: 10.3748/wjg.v20.i32.11262
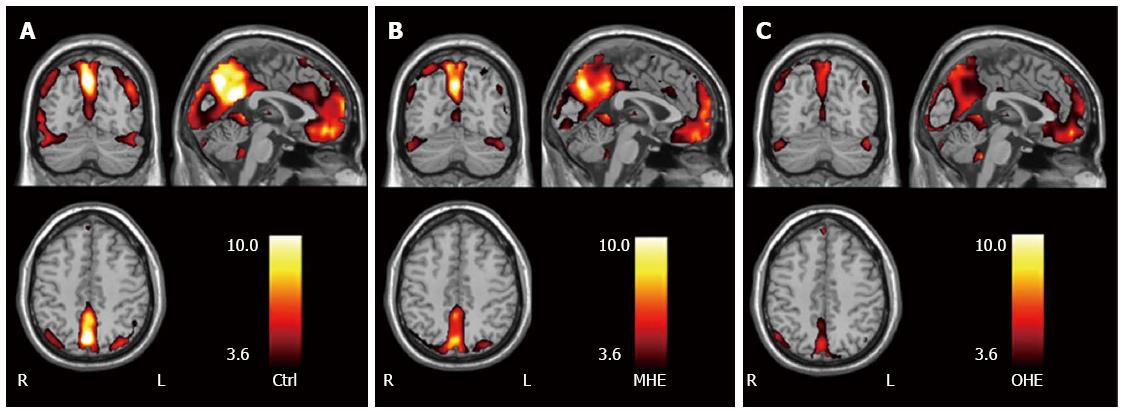
Figure 4 Amplitude of low frequency fluctuation maps in groups of healthy control subjects, patients with minimal hepatic encephalopathy, and patients with overt hepatic encephalopathy.
Group of MHE and group of OHE vs control subjects, P < 0.05. Within each group (A: Group of Ctrl; B: Group of MHE; C: Group of OHE), posterior cingulated cortex and precuneus, medial prefrontal cortex, inferior parietal lobe, and occipital areas show high amplitude of low frequency fluctuation values. Color scale indicates t values. From reference [60] (with permission). Ctrl: Control subjects; MHE: Minimal hepatic encephalopathy; OHE: Overt hepatic encephalopathy. L: Left; R: Right.
- Citation: Zhang XD, Zhang LJ, Wu SY, Lu GM. Multimodality magnetic resonance imaging in hepatic encephalopathy: An update. World J Gastroenterol 2014; 20(32): 11262-11272
- URL: https://www.wjgnet.com/1007-9327/full/v20/i32/11262.htm
- DOI: https://dx.doi.org/10.3748/wjg.v20.i32.11262


