Copyright
©2014 Baishideng Publishing Group Inc.
World J Gastroenterol. Aug 7, 2014; 20(29): 10183-10192
Published online Aug 7, 2014. doi: 10.3748/wjg.v20.i29.10183
Published online Aug 7, 2014. doi: 10.3748/wjg.v20.i29.10183
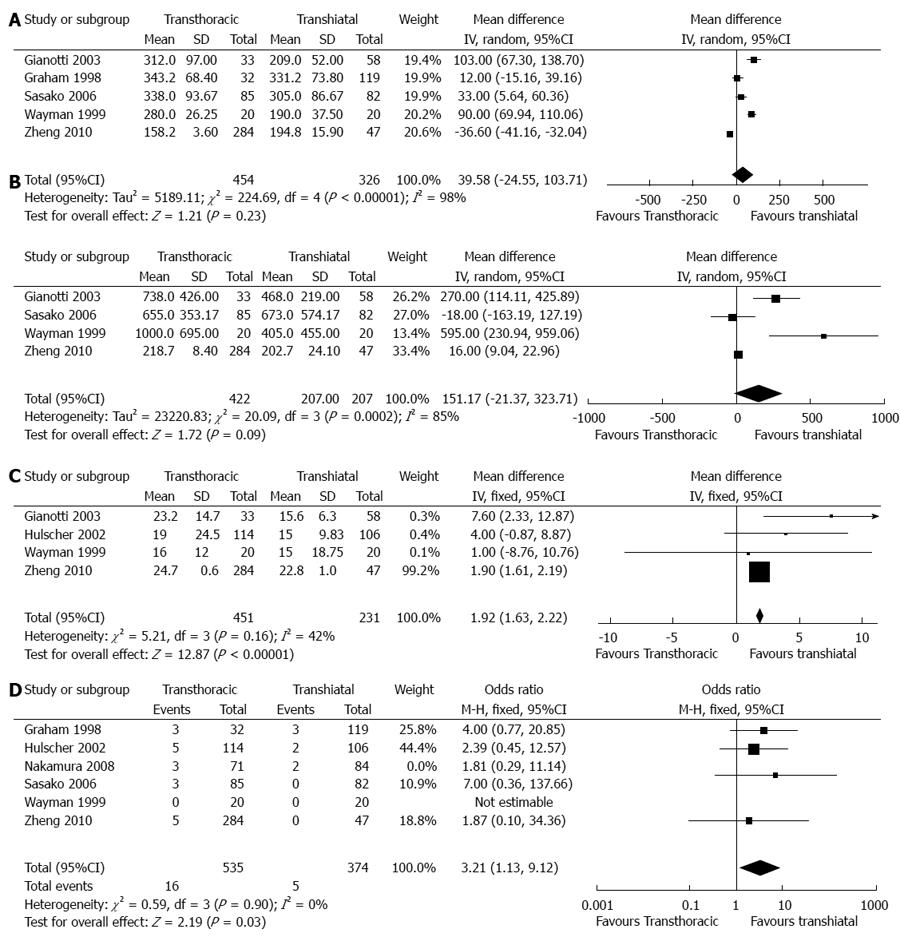
Figure 2 Forest plot of surgery-related data, including the duration of surgical time (A), blood loss (B), hospital stay time (C) and hospital deaths (D), in the transthoracic group vs transhiatal group of cancers of the esophagogastric junction.
IV: Inverse variance; M-H: Mantel-Haenszel.
-
Citation: Wei MT, Zhang YC, Deng XB, Yang TH, He YZ, Wang ZQ. Transthoracic
vs transhiatal surgery for cancer of the esophagogastric junction: A meta-analysis. World J Gastroenterol 2014; 20(29): 10183-10192 - URL: https://www.wjgnet.com/1007-9327/full/v20/i29/10183.htm
- DOI: https://dx.doi.org/10.3748/wjg.v20.i29.10183


