Copyright
©2014 Baishideng Publishing Group Inc.
World J Gastroenterol. Jul 28, 2014; 20(28): 9578-9584
Published online Jul 28, 2014. doi: 10.3748/wjg.v20.i28.9578
Published online Jul 28, 2014. doi: 10.3748/wjg.v20.i28.9578
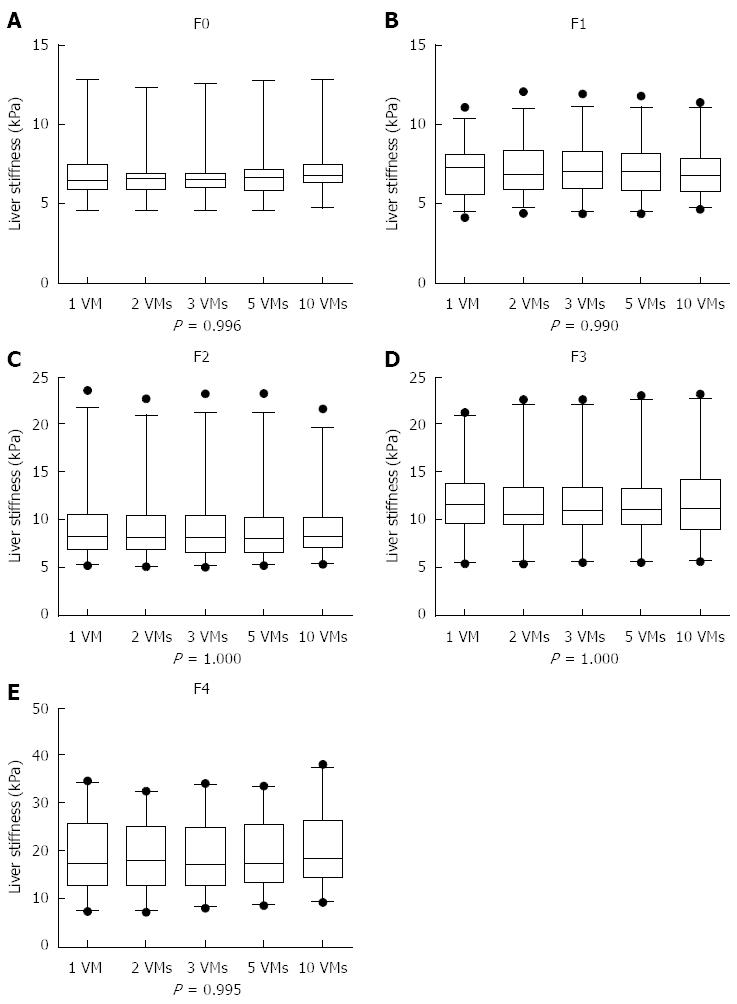
Figure 2 Box-plot showing liver stiffness measurement at different stages of fibrosis in chronic hepatitis B.
Box plots show 25%-75% interquartile range (box), median (middle line), 5%-95% range (two outer lines), and outliers (black dots). LSM: liver stiffness measurement; CHB: Chronic hepatitis B; VMs: Valid measurements.
- Citation: Huang ZP, Zhang XL, Zeng J, Zheng J, Wang P, Zheng RQ. Study of detection times for liver stiffness evaluation by shear wave elastography. World J Gastroenterol 2014; 20(28): 9578-9584
- URL: https://www.wjgnet.com/1007-9327/full/v20/i28/9578.htm
- DOI: https://dx.doi.org/10.3748/wjg.v20.i28.9578


