Copyright
©2014 Baishideng Publishing Group Inc.
World J Gastroenterol. Jul 21, 2014; 20(27): 9178-9184
Published online Jul 21, 2014. doi: 10.3748/wjg.v20.i27.9178
Published online Jul 21, 2014. doi: 10.3748/wjg.v20.i27.9178
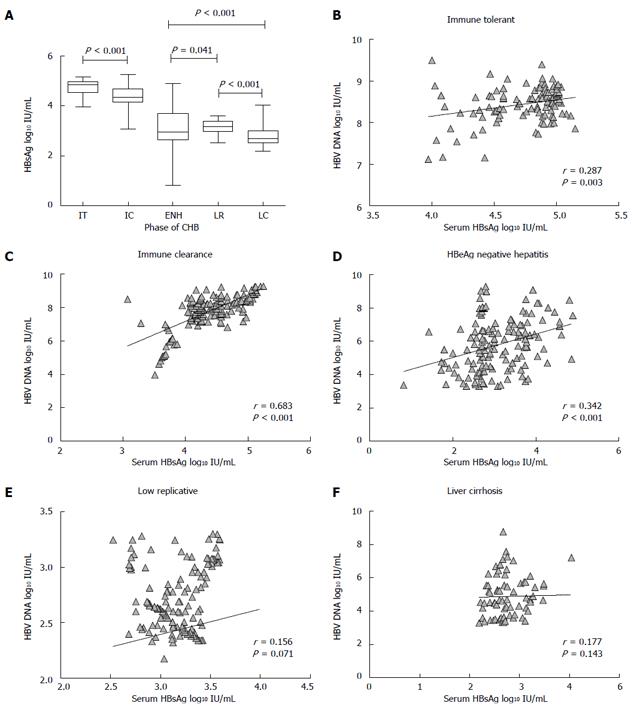
Figure 1 Distribution of hepatitis B surface antigen titers during natural history of chronic hepatitis B and correlation between serum hepatitis B surface antigen titers and hepatitis B virus DNA in different phases of chronic hepatitis B.
A: Median values with 95% confidence interval; B-D: The ratio of serum hepatitis B surface antigen (HBsAg) to hepatitis B virus (HBV) DNA levels in the five phases of chronic hepatitis B (CHB). Dots represent individual values, bars 95%CI of median, and numbers are median values.
- Citation: Zeng LY, Lian JS, Chen JY, Jia HY, Zhang YM, Xiang DR, Yu L, Hu JH, Lu YF, Zheng L, Li LJ, Yang YD. Hepatitis B surface antigen levels during natural history of chronic hepatitis B: A Chinese perspective study. World J Gastroenterol 2014; 20(27): 9178-9184
- URL: https://www.wjgnet.com/1007-9327/full/v20/i27/9178.htm
- DOI: https://dx.doi.org/10.3748/wjg.v20.i27.9178


