Copyright
©2014 Baishideng Publishing Group Inc.
World J Gastroenterol. Jul 7, 2014; 20(25): 8274-8281
Published online Jul 7, 2014. doi: 10.3748/wjg.v20.i25.8274
Published online Jul 7, 2014. doi: 10.3748/wjg.v20.i25.8274
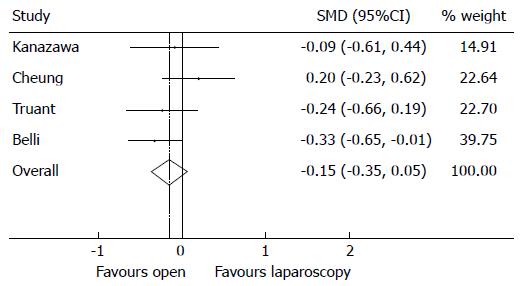
Figure 5 Forest plot comparing standard mean difference of operative times following open and laparoscopic approaches, with 95%CI, P = 0.
142. I2 measure of heterogeneity 24.2%, P = 0.266. SMD: Standard mean differences.
-
Citation: Twaij A, Pucher PH, Sodergren MH, Gall T, Darzi A, Jiao LR. Laparoscopic
vs open approach to resection of hepatocellular carcinoma in patients with known cirrhosis: Systematic review and meta-analysis. World J Gastroenterol 2014; 20(25): 8274-8281 - URL: https://www.wjgnet.com/1007-9327/full/v20/i25/8274.htm
- DOI: https://dx.doi.org/10.3748/wjg.v20.i25.8274


