Copyright
©2014 Baishideng Publishing Group Inc.
World J Gastroenterol. Jun 21, 2014; 20(23): 7197-7206
Published online Jun 21, 2014. doi: 10.3748/wjg.v20.i23.7197
Published online Jun 21, 2014. doi: 10.3748/wjg.v20.i23.7197
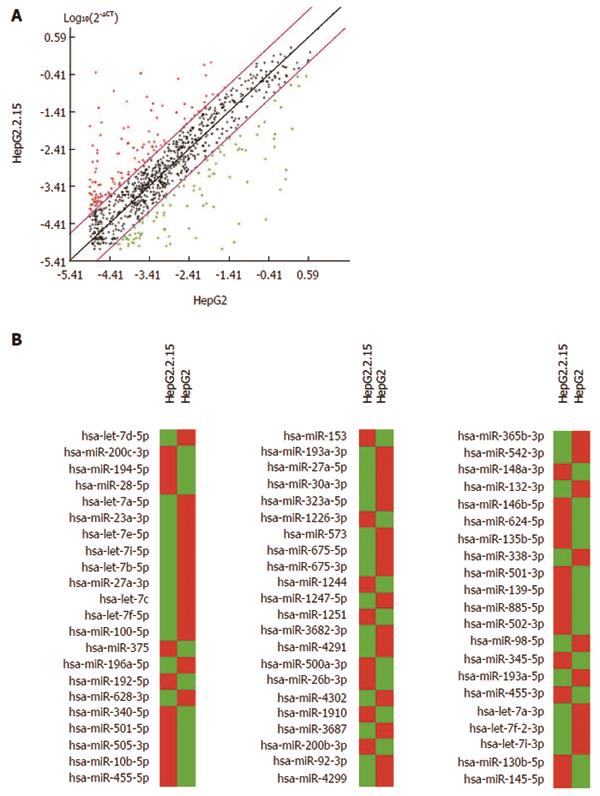
Figure 1 MicroRNAs expression in hepatoma cells HepG2.
2.15 and HepG2. A: Scatter plots of 1008 miRNAs indicate 2-dCT numerical values in HepG2 cells (x-axis) and HepG2.2.15 cells (y-axis). The black line indicates fold changes of 1. The pink lines indicate 5-fold change in miRNA expression threshold, comparing HepG2.2.15 with HepG2. Red + indicates miRNA expressed at least 5-fold higher in HepG2.2.15 than in HepG2 cells. Green + indicates miRNA expressed at least 5-fold lower in HepG2.2.15 than in HepG2 cells. Black + indicates that the difference of miRNA between the two cells was within 5-fold; B: Comparison of miRNAs expression between HepG2 and HepG2.2.15 cells. Red color indicates miRNA expressed at least 5-fold higher in HepG2.2.15 than in HepG2 cells. Green color indicates miRNA expressed at least 5-fold lower in HepG2.2.15 than in HepG2 cells. miRNAs: MicroRNAs.
- Citation: Jiang X, Kanda T, Wu S, Nakamura M, Miyamura T, Nakamoto S, Banerjee A, Yokosuka O. Regulation of microRNA by hepatitis B virus infection and their possible association with control of innate immunity. World J Gastroenterol 2014; 20(23): 7197-7206
- URL: https://www.wjgnet.com/1007-9327/full/v20/i23/7197.htm
- DOI: https://dx.doi.org/10.3748/wjg.v20.i23.7197


