Copyright
©2014 Baishideng Publishing Group Inc.
World J Gastroenterol. Jun 14, 2014; 20(22): 6974-6980
Published online Jun 14, 2014. doi: 10.3748/wjg.v20.i22.6974
Published online Jun 14, 2014. doi: 10.3748/wjg.v20.i22.6974
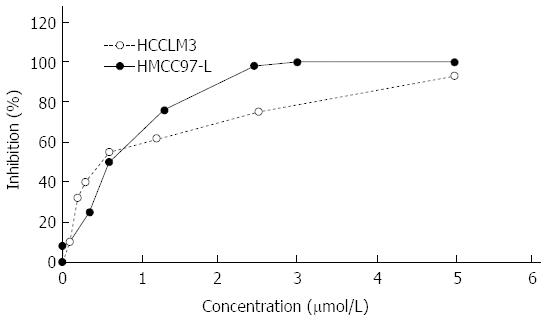
Figure 1 Adriamycin growth inhibition curve for MHCC97-L and HCCLM3 cells.
Adriamycin (ADM) (at concentrations of 0, 0.005, 0.1, 0.35, 0.6, 1.3, 2.45, 5 μmol/L) was added to MHCC97-L and HCCLM3 cells, and the cell death rate was calculated accordingly. The concentration and growth inhibition rates were taken as the X-axis and Y-axis, respectively. ADM LD50 for MHCC97-L cells was significantly lower than that for HCCLM3 cells (0.4123 ± 0.0236 μmol/L vs 0.5259 ± 0.0125 μmol/L, P < 0.05).
- Citation: Sun D, Qin L, Xu Y, Liu JX, Tian LP, Qian HX. Influence of adriamycin on changes in Nanog, Oct-4, Sox2, ARID1 and Wnt5b expression in liver cancer stem cells. World J Gastroenterol 2014; 20(22): 6974-6980
- URL: https://www.wjgnet.com/1007-9327/full/v20/i22/6974.htm
- DOI: https://dx.doi.org/10.3748/wjg.v20.i22.6974


