Copyright
©2014 Baishideng Publishing Group Inc.
World J Gastroenterol. Jun 14, 2014; 20(22): 6869-6877
Published online Jun 14, 2014. doi: 10.3748/wjg.v20.i22.6869
Published online Jun 14, 2014. doi: 10.3748/wjg.v20.i22.6869
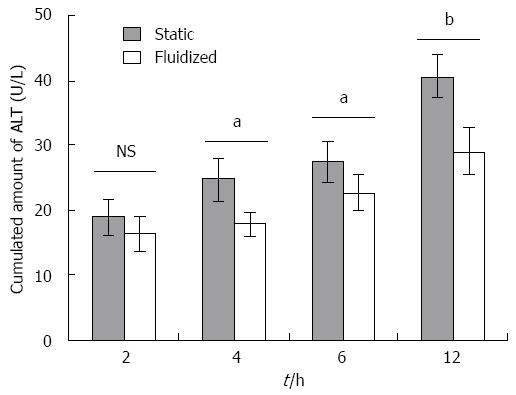
Figure 3 Changes in alanine aminotransferase in encapsulated hepatocytes in medium (n = 5).
Levels are given as U/L (mean ± SD), (gray bar) encapsulated in alginate/chitosan (AC) microcapsules in static conditions; (white bar) encapsulated in AC microcapsules and placed in the choanoid-fluidized bed bioreactor. Student’s t test (aP < 0.05; bP < 0.01, static vs fluidized). NS: Not significant; ALT: Alanine aminotransferase.
- Citation: Yu CB, Pan XP, Yu L, Yu XP, Du WB, Cao HC, Li J, Chen P, Li LJ. Evaluation of a novel choanoid fluidized bed bioreactor for future bioartificial livers. World J Gastroenterol 2014; 20(22): 6869-6877
- URL: https://www.wjgnet.com/1007-9327/full/v20/i22/6869.htm
- DOI: https://dx.doi.org/10.3748/wjg.v20.i22.6869


