Copyright
©2014 Baishideng Publishing Group Inc.
World J Gastroenterol. Jun 7, 2014; 20(21): 6685-6690
Published online Jun 7, 2014. doi: 10.3748/wjg.v20.i21.6685
Published online Jun 7, 2014. doi: 10.3748/wjg.v20.i21.6685
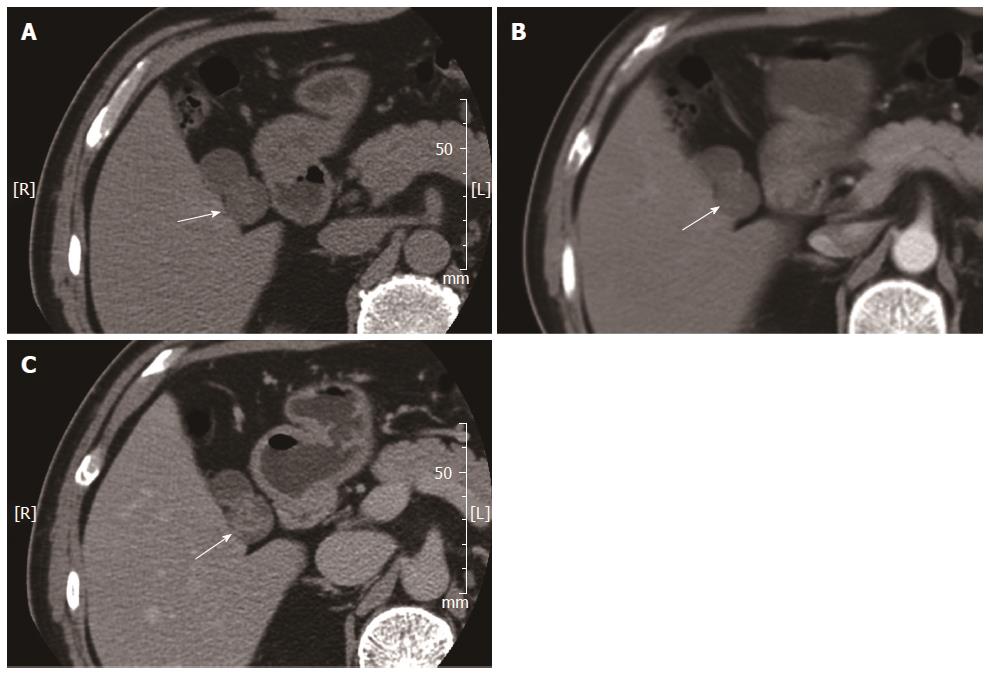
Figure 2 Gallbladder computed tomography imaging.
A: Unenhanced computed tomography shows an iso-attenuating mass (arrow) in the gallbladder; B: No obvious enhancement (arrow) was found in the arterial dominant phase; C: The mass (arrow) shows slight hyper-attenuating in the late venous phase.
- Citation: Liu LN, Xu HX, Zheng SG, Sun LP, Guo LH, Wu J. Solitary schwannoma of the gallbladder: A case report and literature review. World J Gastroenterol 2014; 20(21): 6685-6690
- URL: https://www.wjgnet.com/1007-9327/full/v20/i21/6685.htm
- DOI: https://dx.doi.org/10.3748/wjg.v20.i21.6685


