Copyright
©2014 Baishideng Publishing Group Inc.
World J Gastroenterol. May 21, 2014; 20(19): 5875-5880
Published online May 21, 2014. doi: 10.3748/wjg.v20.i19.5875
Published online May 21, 2014. doi: 10.3748/wjg.v20.i19.5875
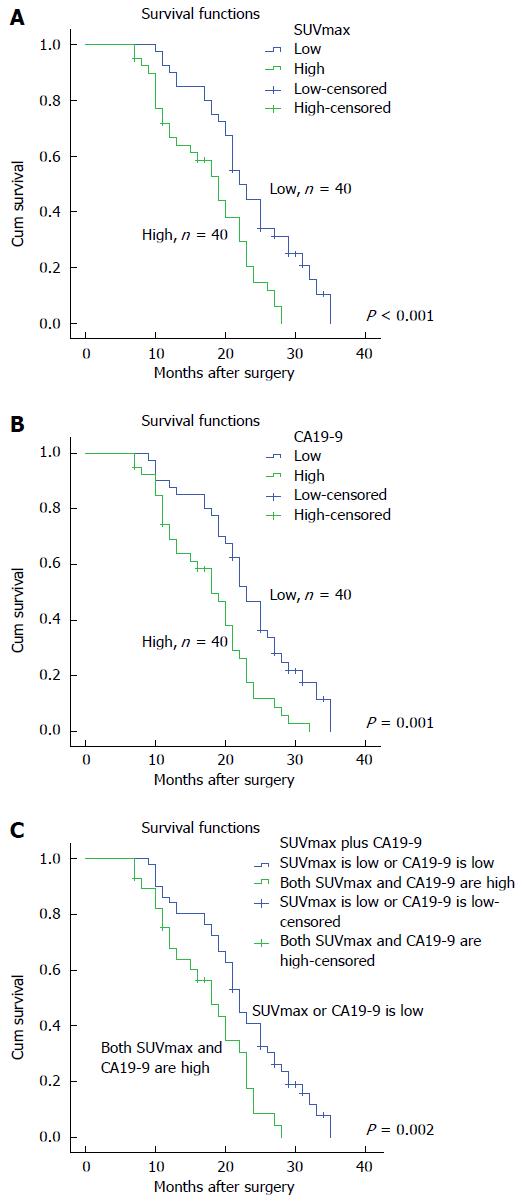
Figure 1 Kaplan-Meier curve for the survival time of patients with pancreatic cancer according to their standardized maximum uptake value or serum carbohydrate antigen 19-9 (n = 80).
A: Standardized maximum uptake value (SUVmax) and survival; upper line, low SUVmax of primary tumor (< 5.35) (n = 40); lower line, high SUVmax of primary tumor (≥ 5.35) (n = 40); B: Serum Carbohydrate antigen (CA)19-9 and survival; upper line, low serum CA19-9 (< 604.5 U/mL) (n = 40); lower line, high serum CA19-9 (≥ 604.5 U/mL) (n = 40); C: SUVmax plus CA19-9 and survival; upper line, low SUVmax (< 5.35) or serum CA19-9 (< 604.5 U/mL) of primary tumor (n = 51); lower line high serum SUVmax (≥ 5.35) plus serum CA19-9 (≥ 604.5 U/mL) of primary tumor (n = 29).
- Citation: Zhao JG, Hu Y, Liao Q, Niu ZY, Zhao YP. Prognostic significance of SUVmax and serum carbohydrate antigen 19-9 in pancreatic cancer. World J Gastroenterol 2014; 20(19): 5875-5880
- URL: https://www.wjgnet.com/1007-9327/full/v20/i19/5875.htm
- DOI: https://dx.doi.org/10.3748/wjg.v20.i19.5875


