Copyright
©2014 Baishideng Publishing Group Inc.
World J Gastroenterol. May 21, 2014; 20(19): 5849-5858
Published online May 21, 2014. doi: 10.3748/wjg.v20.i19.5849
Published online May 21, 2014. doi: 10.3748/wjg.v20.i19.5849
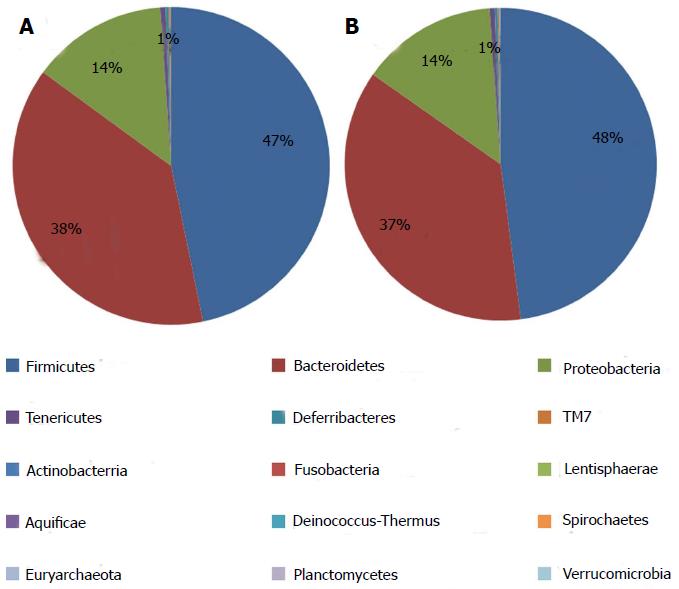
Figure 6 Microbial distributions at phylum level in the samples from the normal and model groups.
Percentages are based on proportions of assignable tags.
- Citation: Li Y, Liu XY, Ma MM, Qi ZJ, Zhang XQ, Li Z, Cao GH, Li J, Zhu WW, Wang XZ. Changes in intestinal microflora in rats with acute respiratory distress syndrome. World J Gastroenterol 2014; 20(19): 5849-5858
- URL: https://www.wjgnet.com/1007-9327/full/v20/i19/5849.htm
- DOI: https://dx.doi.org/10.3748/wjg.v20.i19.5849


