Copyright
©2014 Baishideng Publishing Group Co.
World J Gastroenterol. May 14, 2014; 20(18): 5493-5504
Published online May 14, 2014. doi: 10.3748/wjg.v20.i18.5493
Published online May 14, 2014. doi: 10.3748/wjg.v20.i18.5493
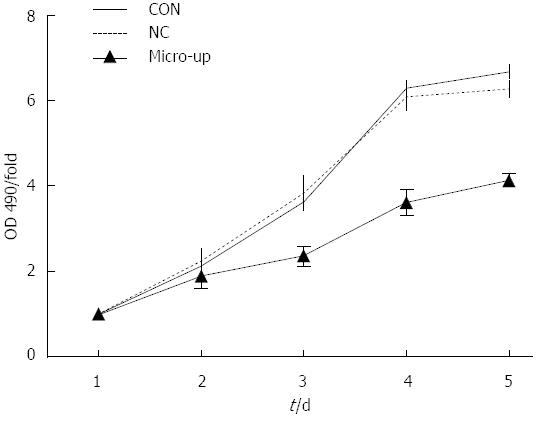
Figure 6 Detection of tumor endothelial cell proliferation before and after transduction.
Five days of continuous observation of each group’s OD values demonstrated that the proliferation of these groups started to show significant differences from day 3; cell proliferation in the micro-up group (2.36 ± 0.23) was significantly lower than that in the CON group (3.65 ± 0.17) and the NC group (3.83 ± 0.39), and the proliferation inhibition rate in the micro-up group (3.61 ± 0.29) presented the largest difference on day 4, as compared to the other two groups (P < 0.01).
- Citation: Cui ZH, Shen SQ, Chen ZB, Hu C. Growth inhibition of hepatocellular carcinoma tumor endothelial cells by miR-204-3p and underlying mechanism. World J Gastroenterol 2014; 20(18): 5493-5504
- URL: https://www.wjgnet.com/1007-9327/full/v20/i18/5493.htm
- DOI: https://dx.doi.org/10.3748/wjg.v20.i18.5493


