Copyright
©2014 Baishideng Publishing Group Co.
World J Gastroenterol. May 14, 2014; 20(18): 5493-5504
Published online May 14, 2014. doi: 10.3748/wjg.v20.i18.5493
Published online May 14, 2014. doi: 10.3748/wjg.v20.i18.5493
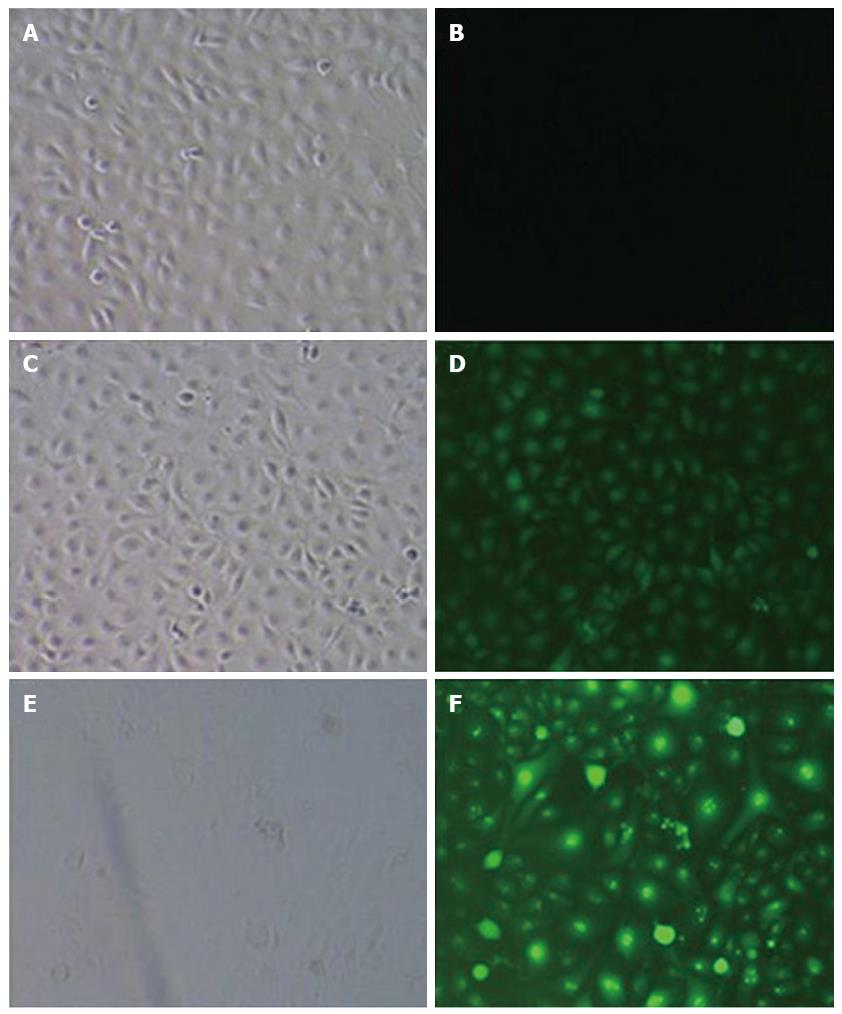
Figure 5 Determination of lentivirus titers after infection of tumor endothelial cells.
GFP expression 3 d after infection. B and G indicate the bright field and the green fluorescence field, respectively (A: CON 100 × B; B: CON 100 × G; C: NC 100 × B; D: NC 100 × G; E: Micro-up 100 × B; F: Micro-up 100 × G). The micro-up group achieved relatively ideal transduction efficiency. The percentage of cells with positive fluorescence was over 90%.
- Citation: Cui ZH, Shen SQ, Chen ZB, Hu C. Growth inhibition of hepatocellular carcinoma tumor endothelial cells by miR-204-3p and underlying mechanism. World J Gastroenterol 2014; 20(18): 5493-5504
- URL: https://www.wjgnet.com/1007-9327/full/v20/i18/5493.htm
- DOI: https://dx.doi.org/10.3748/wjg.v20.i18.5493


