Copyright
©2014 Baishideng Publishing Group Co.
World J Gastroenterol. May 14, 2014; 20(18): 5493-5504
Published online May 14, 2014. doi: 10.3748/wjg.v20.i18.5493
Published online May 14, 2014. doi: 10.3748/wjg.v20.i18.5493
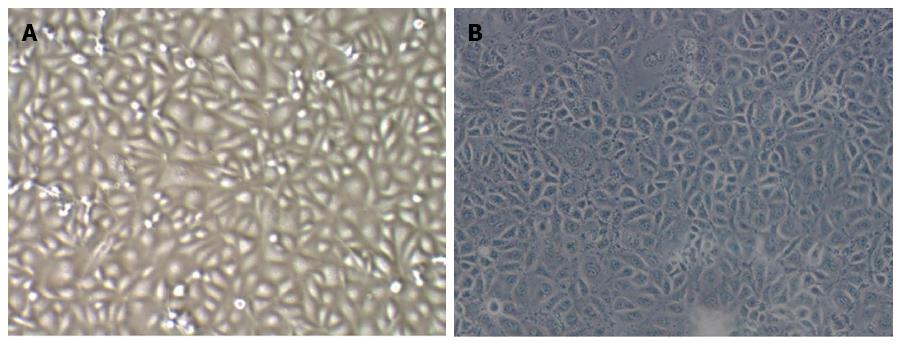
Figure 1 Comparison of the morphology of Tumor endothelial cells and Hepatic sinusoidal endothelial cells.
TECs had different sizes, irregular morphology, and a scattered distribution. HSECs had a uniform morphology and showed a clustered distribution. (A: TEC 100 ×; B: HSEC 100 ×). TEC: Tumor endothelial cell; HSEC: Hepatic sinusoidal endothelial cell.
- Citation: Cui ZH, Shen SQ, Chen ZB, Hu C. Growth inhibition of hepatocellular carcinoma tumor endothelial cells by miR-204-3p and underlying mechanism. World J Gastroenterol 2014; 20(18): 5493-5504
- URL: https://www.wjgnet.com/1007-9327/full/v20/i18/5493.htm
- DOI: https://dx.doi.org/10.3748/wjg.v20.i18.5493


